Solved

Lobby Chart in sort by X Axis

  • 2 March 2020
  • 4 replies
  • 289 views

Userlevel 3
Badge +7

Hi all,


This is my third problem i have posted and so far I’ve had 100% success, so i’m hoping this one will get solved too.


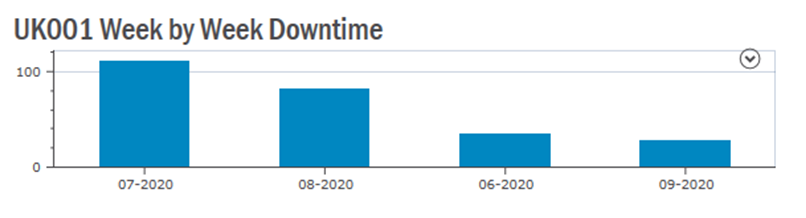
As you can see from the chart below, the data is being sorted by the y axis, as in the higher value or greater amount. I actually want the x axis to be sorted in weeks. In this example i’d want it to look like   06-2020, 07-2020, 08-2020 and last 09-2020.      

Any ideas?


icon

Best answer by asanka 19 March 2020, 00:19

View original

4 replies

Userlevel 4
Badge +9

Following this thread with great interest. I’m having the same issue.

Userlevel 5
Badge +8

We used a concept in the order by (Data Source Designer) like this:

to_char(date_entered,'MM'), to_char(date_entered,'DD'),to_char(date_entered,'YYYY')

For what you are showing something like:
to_char(date_entered,'MM'), to_char(date_entered,'DD')


Userlevel 4
Badge +7

Just make sure the data source order by is set up so that it sorts by the column which you use for x-axis. Never been a problem.

Userlevel 3
Badge +7

Thank you all for your help.


I Found out a much simpler way of doing it. I simply used the ORDER BY  ‘week’  in the Data Source Designer and its sorted the x axis perfectly.


Reply