")

I’ve been testing out seasonal profiles in demand planner (Cloud 23R1), but I am struggling to understand the results and hoping someone may be able to explain the detail.
My understanding is when you create a seasonal profile and then apply it to a forecast, the total forecast sum will be adjusted by the seasonality index for each period.
To test, I created a forecast part & single base flow. I then created a manual seasonal profile for the part. I created the forecast (18 months, Best Fit) , then compared the figures with and without the seasonal profile applied.
Questions:
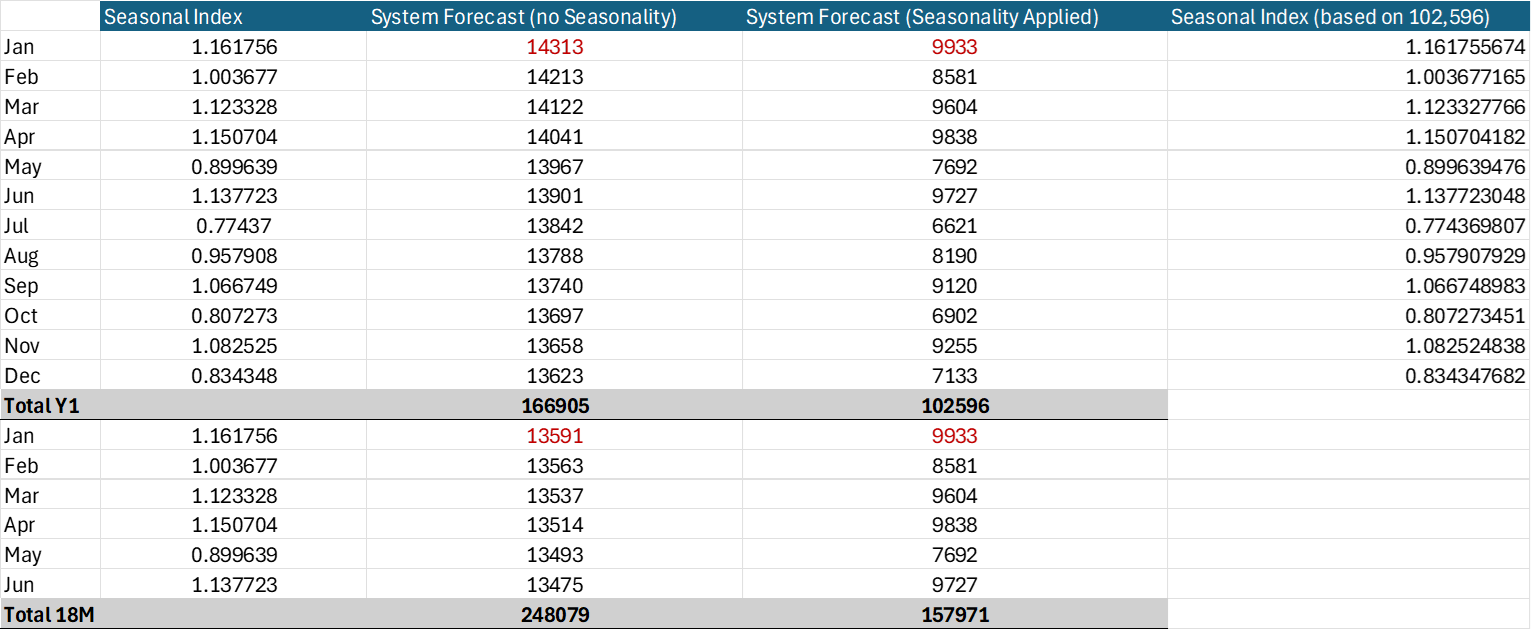
- Why does the total forecast sum for Y1 reduce from 166,905 to 102,596? If I calculate the seasonality index based on the 102,596, for Y1, it lines up, but I cannot explain where the 102,596 has come from?
- Why is the system forecast Jan-June Y2 now the exact same values as Jan-June Y1 when seasonality is applied? Before seasonality is applied Y2 system forecast values are different.