
Debugging Issues in Astea Alliance Application

  • October 11, 2021
  • 3 replies
  • 319 views

Pranavan Paranthaman
Hero (Employee)
Forum|alt.badge.img+9

Debugging an application can be a painful endeavor sometimes, but the Astea Alliance has provided us with a very helpful little tool called the Configuration Editor that forces the application to log all related events and data to the MS Windows Event Viewer where we can easily trace issues.

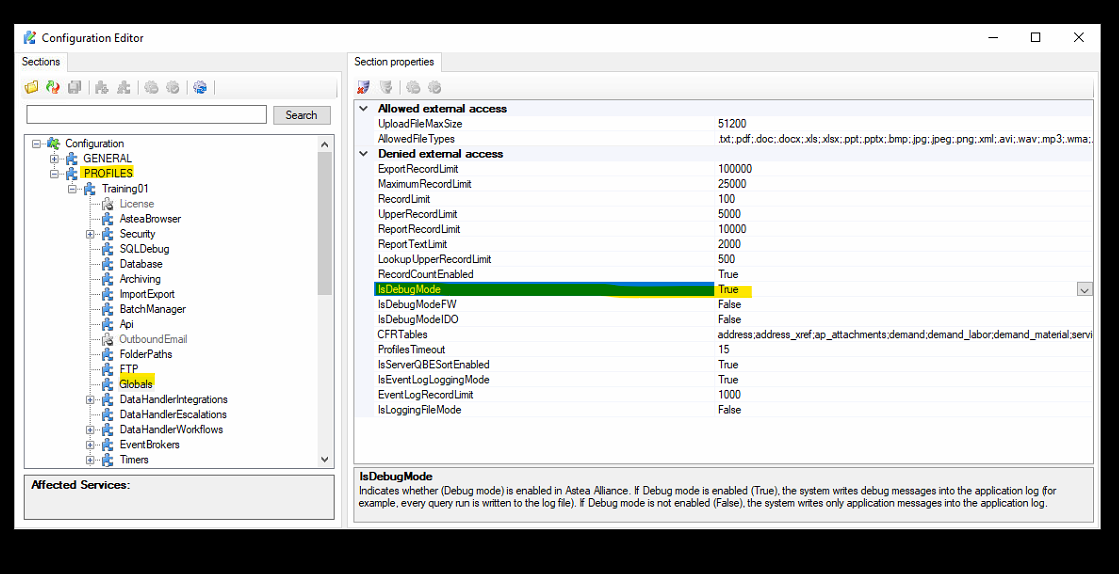
To enable logging in Astea Application, fire up the Configuration Editor.

Navigate to PROFILES -> [YOUR PROFILE NAME] -> Globals and set the IsDebugMode to True

Configuration Editor

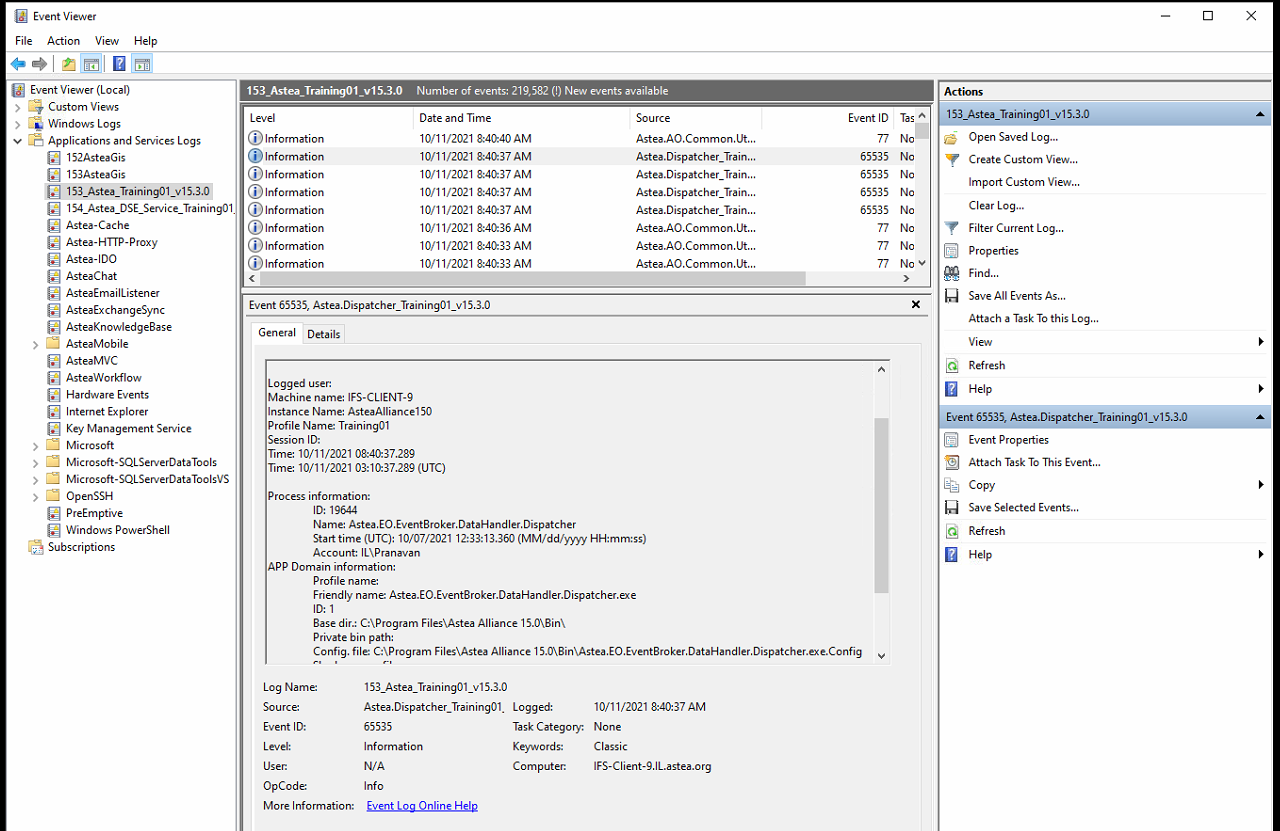
Once enabled you can view these logs in the Event Viewer under Application and Services Logs, in the name of your application instance.


Event Viewer

Additional Notes

IsDebugModeFW - captures framework level event logs.

IsDebugModeIDO - captures mobile application event logs.


Word of Caution

Please be careful when enabling debug modes on production systems, as it will fill up valuable storage space and will cause a performance hit to the application.

Did this topic help you find an answer to your question?

Forum|alt.badge.img+10

Great post!  In addition, for hosted clients, event logs can be retrieved differently based on the following previously-posted articles:

https://community.ifs.com/alliance-users-84/alliance-v15-3-capturing-event-logs-via-the-web-employee-portal-10246

https://community.ifs.com/alliance-users-84/viewing-application-events-for-hosted-solutions-11206


If DebugMode is left off, only errors and warnings are reported to the profile event log.  In most cases these errors are sufficient for the support team to debug errors in the code; however, if the code is not readily available, the information entries added from DebugMode are helpful in determining and troubleshooting application queries, etc.


Reid Gilbert
Superhero (Employee)
Forum|alt.badge.img+15
  • Superhero (Employee)
  • October 11, 2021

Another cool trick you can use when you want to debug or grab a specific API is to turn on the Audit API’s for this User toggle in the Employees Security module (this will work for mobile users as well as users in the back-end Alliance application and can be used when you only want to log API’s for one user in particular and not capture them for everyone system-wide):
 

After you make this change for your user, log out of the application and then log back in and do your same steps (delete a checklist line, etc.)  Now go to the Inbound Data Audit (Integration) module and retrieve the records for your user id.  Sort them by date/time descending, select a row and click on Actions and View API.  This will pop up a window with the API for you (much easier than trying to pull API’s from Event Viewer log files or things of that nature since you can enable/disable this at an individual user level):


Pranavan Paranthaman
Hero (Employee)
Forum|alt.badge.img+9

Thank you @Andrew D'Antonio & @Reid Gilbert for those awesome tips!!


Reply


Cookie policy

We use cookies to enhance and personalize your experience. If you accept you agree to our full cookie policy. Learn more about our cookies.

 
Cookie settings