Solved

Resource Activity Load vs Resource Activity Load Detail


Forum|alt.badge.img+11

Hello,

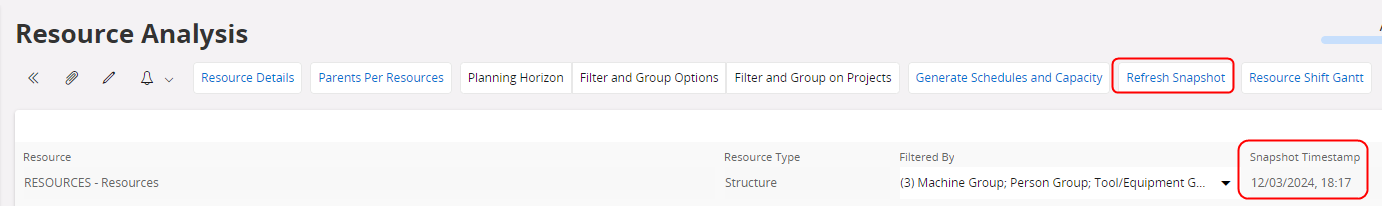
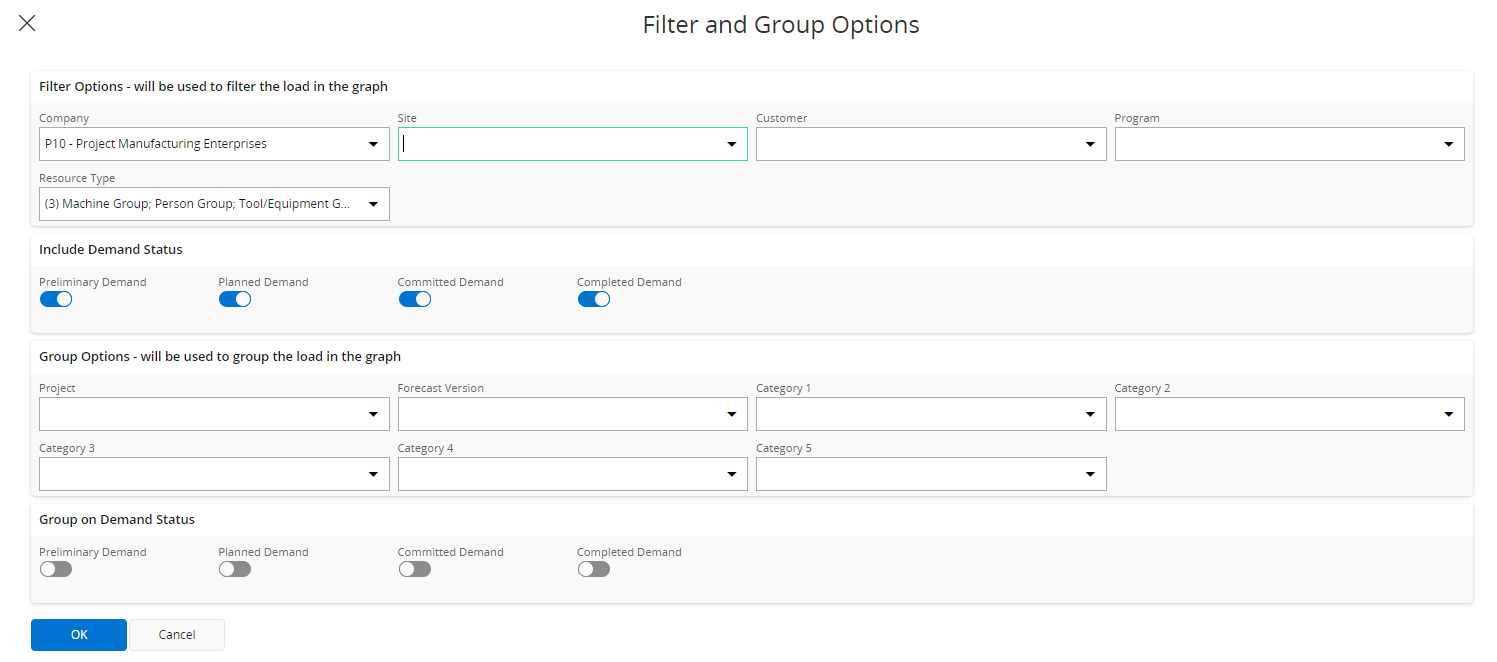
I’m using the old-school resource allocation in Projects.  I’ve got my resource assigned and was checking some data, particularly the Resource Analysis and Resource Activity Load Detail.  The graph nor the detail show any results.  But if I look at the Resource Activity Load, I see what I was looking for.

Any ideas whey I would see numbers in one screen vs another?  Maybe it’s tied to the fact that my Resource Analysis doesn’t show any data in the Graph?

Thank you.

Patrick

PS:  If anyone wants to point me toward help documentation or training material in this section, I’m all ears and eyes.

Best answer by Hugh Batho

There could be a few reasons why the graph is not showing data.

The first is that the graph is based on a snapshot of data, the offsets of which can be set via Resource Basic Data. Expectations would be that the snapshot is refreshed via a reoccurring scheduled task and would only need to be manually refreshed in specific circumstances.


The second is that the graph can also be filtered based on your user's Resource Analysis Parameters, for example by a specific company, a specific status, a specific project or group of projects etc.


As you have already checked that the demand information is available in Resource Activity and that there is a corresponding Resource Activity Load then it should be one of these others that would be impacting what data is available in the graph.

View original
Did this topic help you find an answer to your question?

2 replies

Forum|alt.badge.img+5
  • Hero (Employee)
  • 16 replies
  • Answer
  • March 12, 2024

There could be a few reasons why the graph is not showing data.

The first is that the graph is based on a snapshot of data, the offsets of which can be set via Resource Basic Data. Expectations would be that the snapshot is refreshed via a reoccurring scheduled task and would only need to be manually refreshed in specific circumstances.


The second is that the graph can also be filtered based on your user's Resource Analysis Parameters, for example by a specific company, a specific status, a specific project or group of projects etc.


As you have already checked that the demand information is available in Resource Activity and that there is a corresponding Resource Activity Load then it should be one of these others that would be impacting what data is available in the graph.


Forum|alt.badge.img+11
  • Author
  • Hero (Employee)
  • 119 replies
  • March 15, 2024

That was it, I needed to refresh the snapshot.  This area is so complicated.


Reply


Cookie policy

We use cookies to enhance and personalize your experience. If you accept you agree to our full cookie policy. Learn more about our cookies.

 
Cookie settings