")

This topic explains some techniques that can be used to find out what is causing problems with your middle-tier, for instance Connect message problems, security issues, slow running system, etc.It has been created mainly for IFS Applications 8 with IFS Middleware Server but it should be possible to apply techniques listed here to IFS Applications 9 as well. Some of the areas like Monitoring Console could look differently or have more functionality. Log files should be stored in similar locations as well.
In general, in order to figure out where to look for problems, you have to understand which part of the system is involved. Is the middle-tier involved at all? The process where you have problems, is it a background job (Batch server involved) or a synchronous call? Is the client doing a direct call to the middle-tier or is the database invoking methods in the middle-tier (using the PL/SQL Access Provider)?
In addition to the tools described here, IFS Solution Manager can also be used to monitor some parts of the system, such as message queues, database sessions, background jobs, etc.
Available Techniques
There are quite a few techniques available that will help you figure out what is going on in the system. Sometimes the error report you get from an end user is the exception message presented by the used IFS Applications client. This exception message will in most cases give a hint as to where to continue your investigation. In other cases, when a business process executes in the background you may have to find the appropriate server log files or monitor database sessions, database background jobs, message queues, etc. using IFS Solution Manager.
Following tools are available:
- Exception messages as presented to the client
- Monitoring pages in Solution Manager
- Server log files
- IFS System Monitoring tool for performance monitoring.
- Java Virtual Machine and Application Server monitoring tools such as Java Mission Control or JConsole.
- Java Virtual Machine Heap and thread dumps
Server Log Files
Server log files can be collected after the event as opposed to techniques involving real-time monitoring. Please note that ifsdump script – ifsdump.cmd or ifsdump.sh - located in <ifs_home> can be used to collect them and store in a zip file.
IFS Middleware Server logging
IFS Middleware Server contains different components and therefore produces different logs. This is practical if you know where to look.
The log files are created in <ifs_home>/instance/<instance>/logs/j2ee:
- as_nodemanager.log - Messages produced by the Application Server Node Manager.
- http_nodemanager.log - Messages produced by the HTTP Node Manager.
- AdminServer.log - Messages produced by the Admin Server.
- <ManagedServer>.log - Messages produced for the Managed Server. There will be one for each Managed Server on that host in the cluster.
- http_access.log - The HTTP server access log.
Problems that occurs on the application server is usually logged in <ManagedServer>.log but it if there are more than one Managed Server it can be tricky to know on what server the error occurs on and which of the log files to check. If possible, suspend all Managed Servers except for one and try to reproduce the problem and then check the log file for the only running Managed Server.
Problems that might occur when controlling the Managed Servers, or problems with configuration are most likely to be found in the AdminServer.log.
Problems concerning the communication between the hosts might be found in the as_nodemanager.log or the http_nodemanager.log.
HTTP related errors, such as GET and POST status and similar is most likely found in the http_access.log.
IFS Applications logging
Applications from IFS deployed to the application server use the server logging API to output log records to a number of log files.
Server logging is configured in the IFS_HOME\instance\<instance>\conf\j2ee-logging.properties file. By default, the following log files are created in IFS_HOME\instance\<instance>\logs\j2ee:
- ifsalert.log - ERROR messages from deployed applications
- ifsconnectlog.log - INFO, WARNING and ERROR messages from the parts of IFS Connect that runs in the application server.
- ifsconnectdebug-<thread id>.log - Messages (level according to current configuration) from Connect and the client/soap gateways.
- ifsapplog.log - Messages (level according to current configuration) from deployed applications, excluding Connect and the client/soap gateways.
Batchserver logging
The batchserver is a part of the Integrations platform and will output logging messages to the following files in IFS_HOME\instance\<instance>\logs\batchserver:
- ifsalert.log - ERROR messages from the batchserver.
- ifsconnect.log - INFO, WARNING and ERROR messages from the batchserver
Logging configuration can be changed by editing the logging configuration file IFS_HOME\instance\<instance>\conf\batchserver1-logging.properties. You have to restart the batchserver to apply any changes made.
Connectserver logging
The connectserver is a part of the Integrations platform and will output logging messages to the following files in IFS_HOME\instance\<instance>\logs\connectserver:
- ifsalert.log - ERROR messages from the connectserver.
- ifsconnect.log - INFO, WARNING and ERROR messages from the connectserver.
Logging configuration can be changed by editing the logging configuration file IFS_HOME\instance\<instance>\conf\connectserver1-logging.properties. You have to restart the connectserver to apply any changes made.
Real-time System Monitoring
In order to use the real-time monitoring techniques based on querying JMX MBeans such as IFS System Monitoring and Java Mission Control, there are some considerations.
First of all, access to JMX Beans is protected by default in IFS and it is protected by the same security settings as IFS Middleware Servers' Admin Server. You will need this username and password when starting any monitoring session.
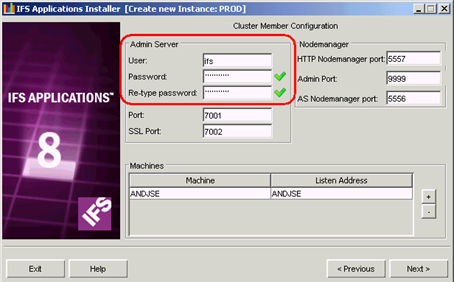
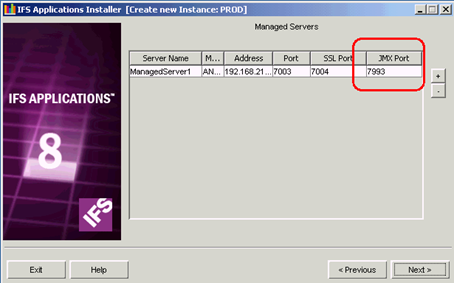
Secondly, access to JMX MBeans requires that the JVM is started with a number of arguments. Among these arguments, you need to specify a unique port that will be used by the monitoring application. This port is called the "JMX Port" and you specify its value when registering Managed Servers in IFS Installer.
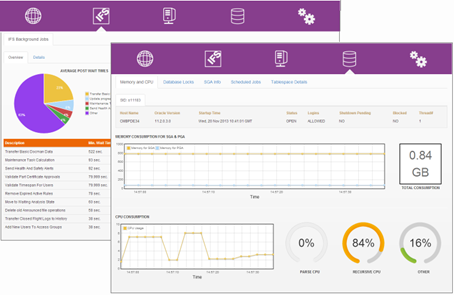
IFS System Monitoring
The System Monitoring Console is a tool for monitoring the performance of IFS Applications. When it comes to performance, all layers in a production environment need to be monitored. Thus the monitoring console, looks into the database, middleware server as well as critical areas within IFS business logic to find clues that indicate performance issues
The monitoring application should be used to quickly get an idea of the overall system performance and behaviour. It should not be a replacement for other more advanced tools and applications.
The IFS System Monitoring tool can be accessed from the following URL for a given environment. Use the middleware server admin user credentials to login to the monitoring tool.
http://<admin_server_host>:<admin_server_port>/monitoring/console
Please note that IFS System Monitoring tool can only be used with IFS Middleware Server and no other application server.
Please note that IFS System Monitoring may require changing of default polling settings so no adverse effects are experienced on database. Details can be found in Help\Documentation Settings section.
More details about each monitoring area can be found in the tool itself (help/documentation).
Java Mission Control and Flight Recorder
Java Mission Control and Flight Recorder are Java Virtual Machine monitoring applications included in the Sun Java distribution as of JDK 7 Update 45. The tool is available in your IFS_HOME (in java\bin).
Create a connection and enter credentials:
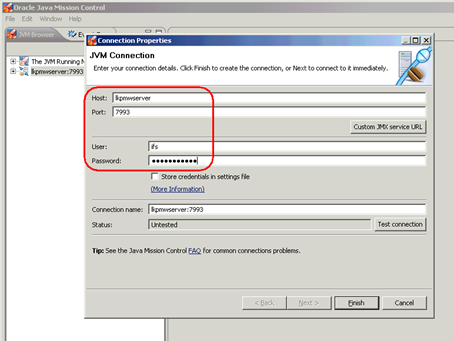
The MBean Server:
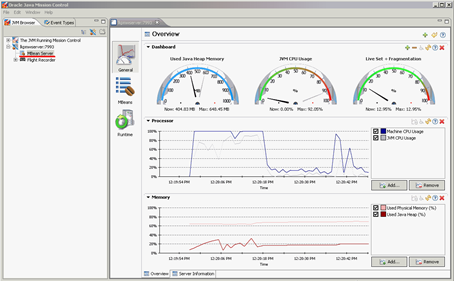
Flight Recording
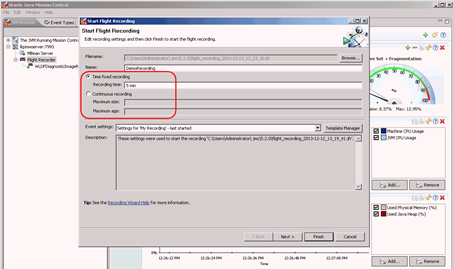
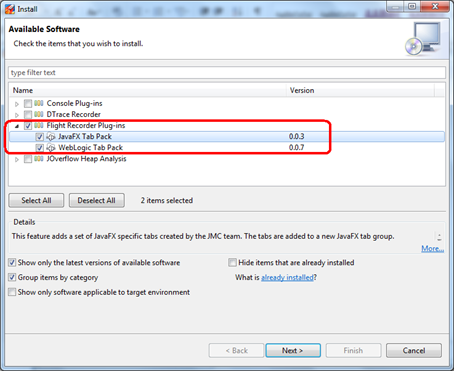
When performing Flight Recording following plugin is highly recommended as it gives one insight into information specific for Middleware server. In order to obtain free plugin please follow these steps.
Select Install New Software
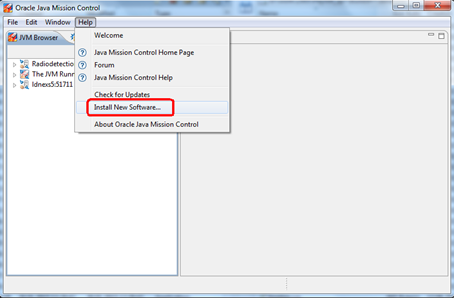
Select following items and press next
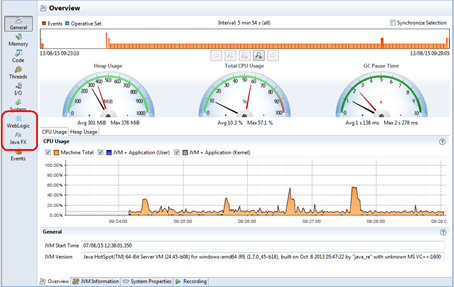
Once recording is done following tabs become available
Using JConsole
JConsole is a Java Virtual Machine monitoring application included in the Sun Java distribution. The tool is available in your IFS_HOME (in java\bin). Using JConsole you can monitor the behaviour of the Java VM running your application server, especially memory consumption, garbage collection and CPU usage. This tool is very valuable if you are tracing down OutOfMemoryExceptions or trying to size your Java heaps appropriately.
In order to be able to use the JConsole tool it needs to be able to connect remotely to your Java VM. You can configure this as a couple of custom Java VM parameters to your Java VM. You can do this from the IFS Installer (Custom JVM Parameters). The following parameters let you connect remotely without having to provide a username or password. Please note that Middleware has this enabled by default and you can use JMX port specified in installer for each of ManagedServers:
-Dcom.sun.management.jmxremote.authenticate=false
-Dcom.sun.management.jmxremote.ssl=false
-Dcom.sun.management.jmxremote.port=<port>
where <port> is the network port you connect to using JConsole.
Note: This will cause a port conflict if done on an environment with more than one Managed Server on the same host!
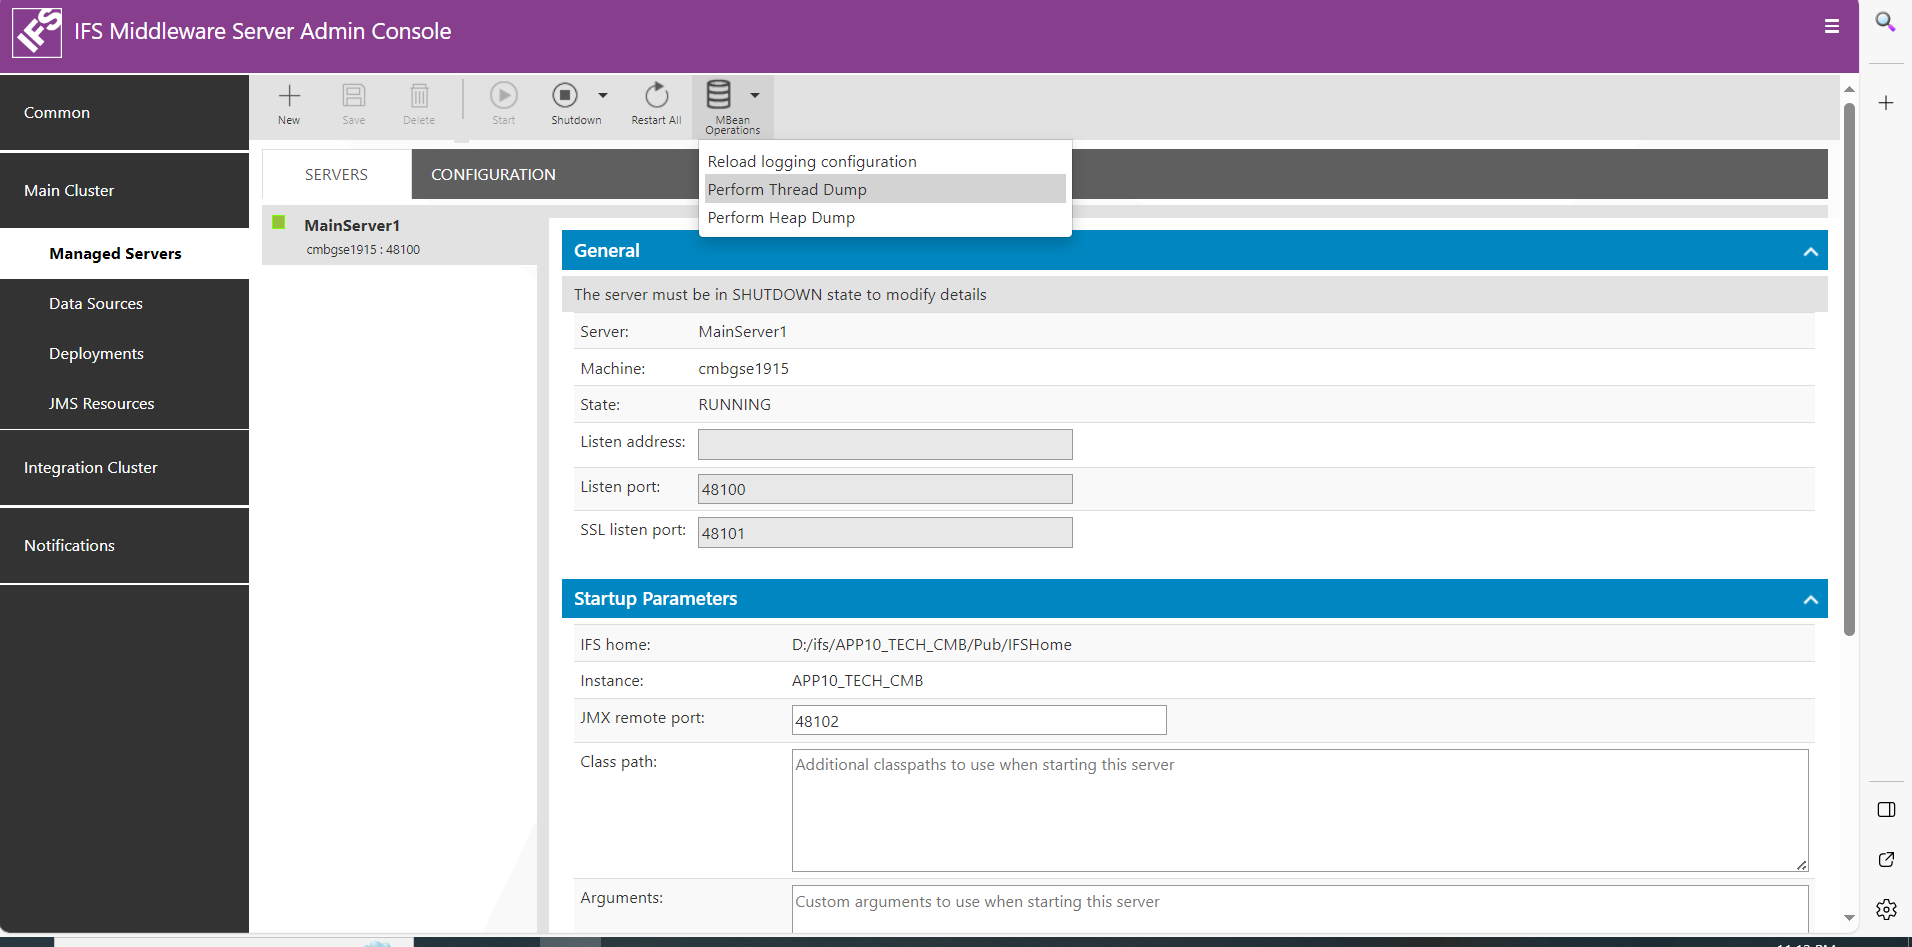
Java Virtual Machine Heap and thread dumps
In order to preseve information that will be lost once ManagedSerer is restarted thread and heap dumps may be performed to store content of running threads or state of JVM in a file. To perform those please use JVisualVM tool. It is located in IFS_HOME (in java\bin) as jvisualvm.exe
Thread Dump
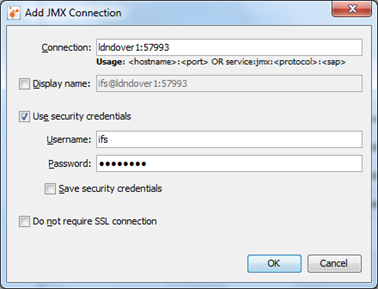
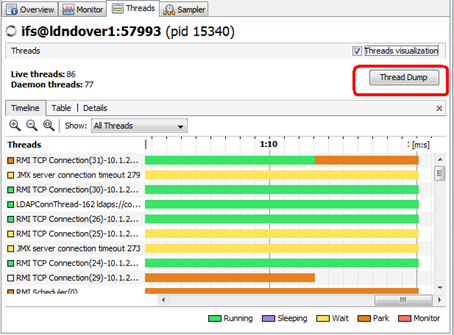
To perform thread dump start new JMX connection using ifs user and JMX port
Once connection is esteblished navigate to Threads tab and use Thread Dump button to load all thread
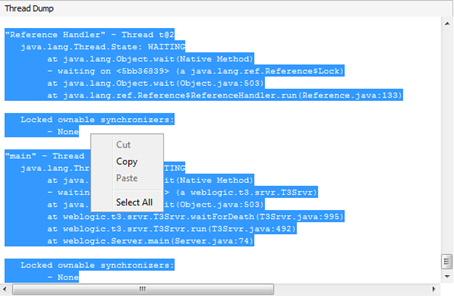
Copy content and paste to a file
Heap Dump
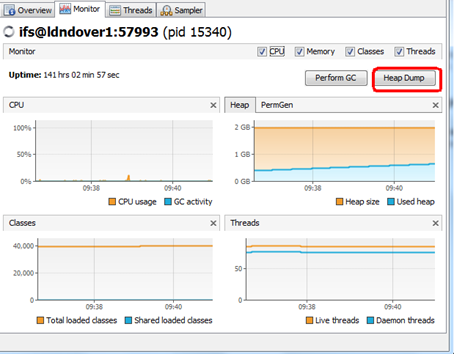
For Heap Dump use Heap Dump button from Monitor tab
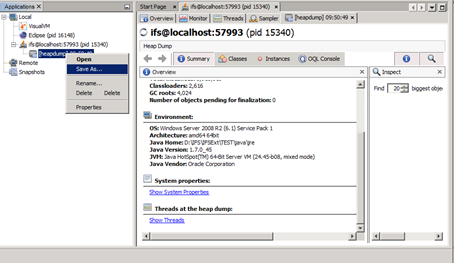
It will load heap dump in the application. To save it use RMB option to save to a file.
Tracing down problems
Where do you start looking if you have a problem with your system? This depends on what kind of problem you have and which parts of the system is involved. The key to chasing down problems are to understand how the system works, or at least which parts of the systems participate in the process where you have problems.
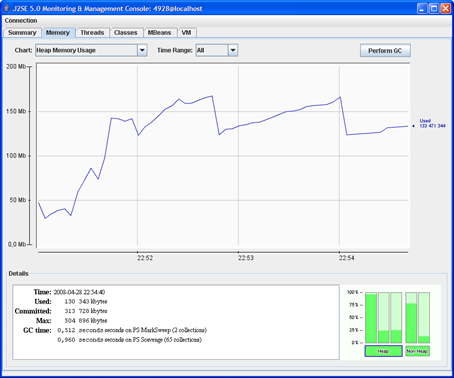
The system is very slow
Many things can cause a non-responsive system, but if you suspect something in the middle-tier rather than in the database a good start is to monitor heap memory usage and CPU usage using the System Monitoring tool or JConsole. When memory consumption start to approach your maximum configured Java heap size, CPU usage often also goes up. If you notice this behaviour, does it happen periodically? Is it when you do something special? Really large reports or Connect messages has been known to consume lots of memory, in some rare cases even to the point where you get an OutOfMemoryException (there's not enough memory available to complete the request).
If you do get OutOfMemoryExceptions (it will be written to the appropriate server log files) it's important to understand that the client that got an OutOfMemoryException isn't necessarily the one that used "too much" memory. It simply means that there isn’t enough memory available to complete the request. Also note that the application server usually handles OutOfMemoryExceptions without needing a restart.
Batchserver and queue problems?
If you have problems processing queue messages, make sure you enable queue logging using IFS Solution Manager. Also have a look at the batchserver log files.
Communication problems with an external system using a connector?
Make sure you enable queue logging using IFS Solution Manager.
Is the database doing synchronous calls to the application server?
Outgoing synchronous bizAPIs, report previewing, security checkpoints, etc. use the PL/SQL Access Provider to communicate with the application server. Has it been configured correctly? The configuration is in the PLSQLAP_ENVIRONMENT_TAB database table (automatically configured during installation). You can also use the Monitoring Console in Solution Manager.
")
")