In IEE you start debugger and press
Get the result here
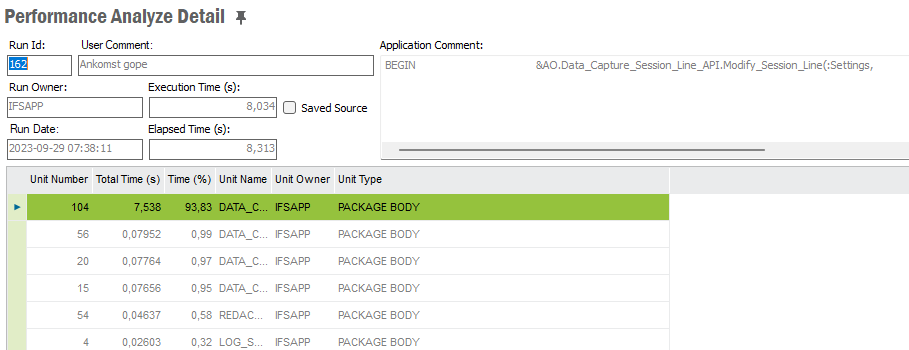
How do one do this in IFS Cloud/Aurena?
In IEE you start debugger and press
Get the result here
How do one do this in IFS Cloud/Aurena?
Hi
in Aurena you can start it as following. In IFS Cloud it should be the same.
In this client?
Hi
You can check Server Invokes from the second tab in the Aurena Debug Console.
Clients in IEE to analyze it
Hi
To check and analyze performance in IFS Cloud - Aurena client you have to navigate to Application Monitoring Console.
There is no window called Performance Analyze Overview in IFS Cloud!
The Application Monitoring Console is a tool for monitoring the status of IFS Cloud with concern to various of parameters important in order to have a well working application. You find the console by clicking on Application Monitoring Console found in Solution Manager / Monitoring / Application Monitoring folder. The entries are configured the Application Monitoring Console Configuration.
Please refer to the following tech docs for more information:
Hi
The Oracle Profiler is not available on an environment per default and to install it the standard Oracle scripts "Proftab.sql" and "Profload.sql" needs to be executed as user SYS on the database.
Unfortunately in IFS Managed Cloud environments the Oracle Profiler scripts are not deployed per default. This means that the Oracle Profiler is not available for performance investigations.
It can be deployed upon request and recommend you request Oracle Profiler in IFS Cloud.
Hi
Unfortunately, you can’t! You will have to start it from e.g., PL/SQL Developer and run the Aurena command in a Test Window.
Enter your E-mail address. We'll send you an e-mail with instructions to reset your password.