
Question

DDMRP Parameter Optimization

  • September 9, 2026
  • 2 replies
  • 38 views

■Background
I understand that, when using DDMRP, users need to define their own values for the Lead Time Category and Variability Category.
To optimize inventory levels, we would like to set appropriate values for the Lead Time Category and Variability Category. What criteria or methodology should be used to determine these values?

For context, we are considering using DDMRP for the procurement of purchased items, rather than for manufactured items.

■Question
When using DDMRP, how should the Lead Time Category and Variability Category be determined? Please advise based on best practices adopted by other companies.

Parameters in scope
Lead Time Category:
1.Red Lead Time Factor (%)
2.Green Lead Time Factor (%)
Variability Category:
3. Variability Factor (%)

To reiterate, as part of our ongoing DDMRP operations, I would like to review parameters 1, 2, and 3 periodically and maintain them at appropriate levels.

Could you please advise what criteria or methodology should be used to calculate the appropriate values for these three parameters?
 

After the initial parameter setup, during the operational phase, which metrics or values should we monitor in IFS to determine whether the inventory levels maintained through DDMRP are appropriate? Also, what logic or criteria should be used when adjusting the parameters?

We would appreciate it if you could share any real-world examples of how DDMRP has been operated and managed in practice.


2 replies

Forum|alt.badge.img+9
  • Hero (Employee)
  • September 9, 2026

Hi.  I found the following information -


When implementing Demand Driven Material Requirements Planning (DDMRP) for purchased items (procurement), the goal is to decouple supply chain variability and maintain high material availability without inflating working capital.

Below is a best-practice guide for determining, monitoring, and optimizing the three core buffer profile parameters (Red Lead Time Factor, Green Lead Time Factor, and Variability Factor) within IFS.

1. Fundamentals of DDMRP Buffer Zones & Parameter Roles

In IFS, DDMRP buffer levels are calculated using Average Daily Usage (ADU), Lead Time (LT) (Purchased Part Supplier Lead Time + Inspection/Arrival Lead Time), and the three profile parameters:

  • Red Zone (Safety & Base): Protects against demand/supply noise.
    $$\text{Red Base} = \text{ADU} \times \text{Lead Time} \times \text{Red Lead Time Factor}$$
    $$\text{Red Safety} = \text{Red Base} \times \text{Variability Factor}$$
    $$\text{Top of Red (TOR)} = \text{Red Base} + \text{Red Safety}$$

  • Yellow Zone (Primary Coverage): Covers expected usage over the lead time.
    $$\text{Yellow Zone} = \text{ADU} \times \text{Lead Time}$$

  • Green Zone (Order Sizing & Frequency): Determines average order size and reorder frequency.
    $$\text{Green Zone} = \max\left(\text{ADU} \times \text{Lead Time} \times \text{Green Lead Time Factor},, \text{MOQ},, \text{Order Cycle}\right)$$

2. Methodology to Determine Initial Parameters for Purchased Parts

When categorizing purchased items into Lead Time Categories and Variability Categories, use the following criteria based on Demand Driven Institute (DDI) standards:

A. Lead Time Category Parameters

Purchased items should be classified by total procurement lead time (Supplier Lead Time + Transit + Internal Receiving/Inspection):

  1. Red Lead Time Factor (%):

    • Short Lead Time Parts (< 7–10 days / Local Suppliers): Set Higher % (60% – 80%).

      • Reasoning: Because the Yellow Zone ($\text{ADU} \times \text{LT}$) is small, a higher Red factor ensures the safety buffer is sufficient to absorb daily usage spikes or minor receiving delays.

    • Medium Lead Time Parts (10 – 30 days / Regional Suppliers): Set Moderate % (40% – 60%).

    • Long Lead Time Parts (> 30–45 days / Overseas / Import Parts): Set Lower % (20% – 40%).

      • Reasoning: Long lead time items already have very large Yellow zones. Setting a high Red factor creates an excessively large buffer, tying up unnecessary cash flow.

  2. Green Lead Time Factor (%):

    • Short Lead Time Parts: Set Higher % (50% – 100%).

      • Reasoning: Prevents creating daily micro-purchase orders with local suppliers.

    • Medium Lead Time Parts: Set Moderate % (30% – 50%).

    • Long Lead Time Parts: Set Lower % (10% – 20%).

      • Reasoning: For long lead time parts, supplier Minimum Order Quantities (MOQs) or container batch sizes often dictate the Green Zone size rather than the Green Lead Time Factor.

B. Variability Category Parameter

For purchased items, variability stems from two factors:

  1. Demand Volatility: Measured by the Coefficient of Variation ($CV = \frac{\sigma}{\mu}$) of consumption.

  2. Supply / Vendor Volatility: Supplier On-Time In-Full (OTIF) performance and transit time uncertainty.

  3. Variability Factor (%):

    • Low Variability Category ($CV < 0.4$, Vendor OTIF $> 95%$): Set 10% – 30%.

    • Medium Variability Category ($CV = 0.4 - 0.8$, Vendor OTIF $85% - 95%$): Set 35% – 50%.

    • High Variability Category ($CV > 0.8$, Vendor OTIF $< 85%$ or overseas port risks): Set 55% – 80%+.

Lead Time / Variability Profile

Red LT Factor (%)

Green LT Factor (%)

Variability Factor (%)

Typical Item Types

Short LT / Low Var

70% – 80%

70% – 100%

15% – 25%

Local hardware, standard fasteners, fast-replenishment items

Short LT / High Var

60% – 75%

50% – 70%

60% – 80%

Standard local fittings with volatile production demand

Long LT / Low Var

20% – 35%

15% – 25%

20% – 30%

Overseas raw materials with stable contract demand

Long LT / High Var

20% – 30%

10% – 20%

60% – 80%+

Overseas electronics/custom parts with volatile demand & transit delays

4. Operational Phase: Metrics to Monitor in IFS

In the operational phase, use the following IFS DDMRP views and KPIs to evaluate whether buffer settings are performing effectively:

Core IFS Screens to Monitor:

  • Buffer Part Status / Operational Buffer Status: Check the Net Flow Position (NFP) and current On-Hand Alert Status (Red, Yellow, Green, Over-Green, Black/Stockout).

  • Buffer Part Attributes Log: Tracks historical ADU, Buffer Zone sizes, and parameter changes over time.

Key Performance Indicators (KPIs):

  1. Days in Black (Stockout Rate):

    • Target: Zero or near-zero stockouts.

    • Indicator: If a part frequently drops into the "Black" (zero on-hand), the buffer is under-sized.

  2. Time Spent in Red Zone:

    • Target: On-hand inventory should spend $< 10% - 15%$ of time in the Red zone.

    • Indicator: If on-hand is consistently in the Red zone, safety stock is being continuously eroded.

  3. Time Spent in "Over-Green" Status:

    • Target: Near zero.

    • Indicator: On-hand consistently above Top of Green (TOG) indicates over-buffering, excessive supplier MOQs, or uncoordinated batch orders.

  4. Actual Average On-Hand vs. Target Average On-Hand:

    • DDMRP Target Average On-Hand is calculated as:
      $$\text{Target Avg On-Hand} = \text{Top of Red} + \left(\frac{1}{2} \times \text{Green Zone}\right)$$

    • Compare actual average on-hand from IFS Inventory statistics against this target. If actual on-hand is significantly higher, inventory reduction opportunities exist.

5. Logic & Criteria for Parameter Adjustments

Perform a periodic review (e.g., monthly or quarterly) using the following decision rules:


+-----------------------------------+ | Periodic DDMRP Review (IFS) | +-----------------------------------+ | +----------------------------------+-----------------------------------+ | | | v v | [ Stockouts / High Red Time ] [ Frequent Over-Green Status ] v | | [ Seasonal Demand Spike ] v v | • Increase Variability Factor • Decrease Green LT Factor v • Reclassify to High Var • Negotiate lower MOQ with Supplier • Apply Zone Adjustment • Re-check Supplier Lead Time • Reclassify to Lower LT Cat Factor (ZAF) in IFS

  • Criteria 1: Increase Variability Factor or Red Factor

    • Trigger: On-hand frequently enters Red/Black, or actual demand $CV$ has increased over the last 90 days.

    • Action: Upgrade item to a higher Variability Category or increase Variability Factor by 10–15%.

  • Criteria 2: Decrease Green Factor / Address MOQ

    • Trigger: On-hand is persistently Over-Green, or order frequency is too low.

    • Action: Reduce Green Lead Time Factor. If the Green zone is driven by a supplier MOQ rather than the factor, work with procurement to negotiate smaller MOQs or batch splits.

  • Criteria 3: Adjust Lead Time (Not just factors)

    • Trigger: Actual PO receiving lead time consistently differs from the master Supplier Lead Time.

    • Action: Update the actual Purchase Lead Time in IFS (Supplier for Purchase Part), as buffer zones scale directly with lead time.

  • Criteria 4: Seasonal / Temporary Demand Shifts

    • Action: Do not permanently change the profile factors. Instead, apply Demand Adjustment Factors (DAF) or Zone Adjustment Factors (ZAF) in IFS to scale buffers up/down for specific date ranges.

6. Real-World Operational Examples

Example 1: Overseas Raw Material (Long Lead Time, Sea Freight)

  • Item: Specialty imported chemical resin (Purchased Part)

  • Lead Time: 60 days (50 days shipping + 10 days custom/inspection)

  • Profile: Long LT / Medium Variability

  • Parameters: Red LT Factor = 25%, Green LT Factor = 15%, Variability Factor = 40%

  • Outcome: The large 60-day Yellow Zone covers the main pipeline. The lower Red/Green factors prevent over-capitalization, while the 40% Variability factor successfully absorbs 5–7 day port congestion delays without triggering stockouts.

Example 2: High-Volume Standard Fastener (Short Lead Time, Local Supplier)

  • Item: Standard M8 Bolt (Purchased Part)

  • Lead Time: 3 days

  • Profile: Short LT / Low Variability

  • Parameters: Red LT Factor = 75%, Green LT Factor = 80%, Variability Factor = 20%

  • Outcome: Higher Red/Green factors ensure order sizes are reasonable (avoiding daily order lines to the supplier) while maintaining a safe buffer cushion relative to the very small Yellow Zone.


I hope this information helps.  Thanks!  Jane


majose
Hero (Employee)
Forum|alt.badge.img+15
  • Hero (Employee)
  • September 10, 2026

Hello ​@Keitato.N 

Above answer gave a very comprehensive introduction how to set the parameters that controls the Buffer Zones in DDMRP.

I give you, and others, some more info how to set these values in IFS Cloud, perhaps obvious for some guys, but perhaps helpful for others.

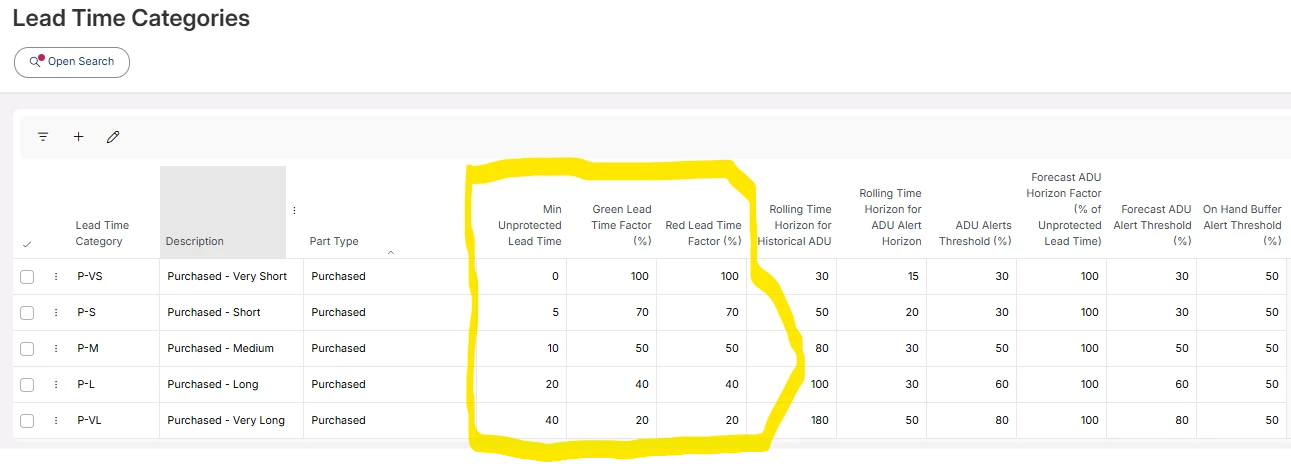
When you calculate Cumulative Lead Time in IFS Manufacturing system will also set the Unprotected Lead Time. In the same job, Lead Time Category Classification will occur, and here the logic looks into the basic data of:

(In above screen dump I just searched for Purchased Part Type)

For each DDMRP planned part, system of course knows the Part Type and the Lead Time, then it finds out which Lead Time Factor Values it should use.

In this page users can modify the threshold values of Min Unprotected Lead Time. The percentage factors can also be modified.

***

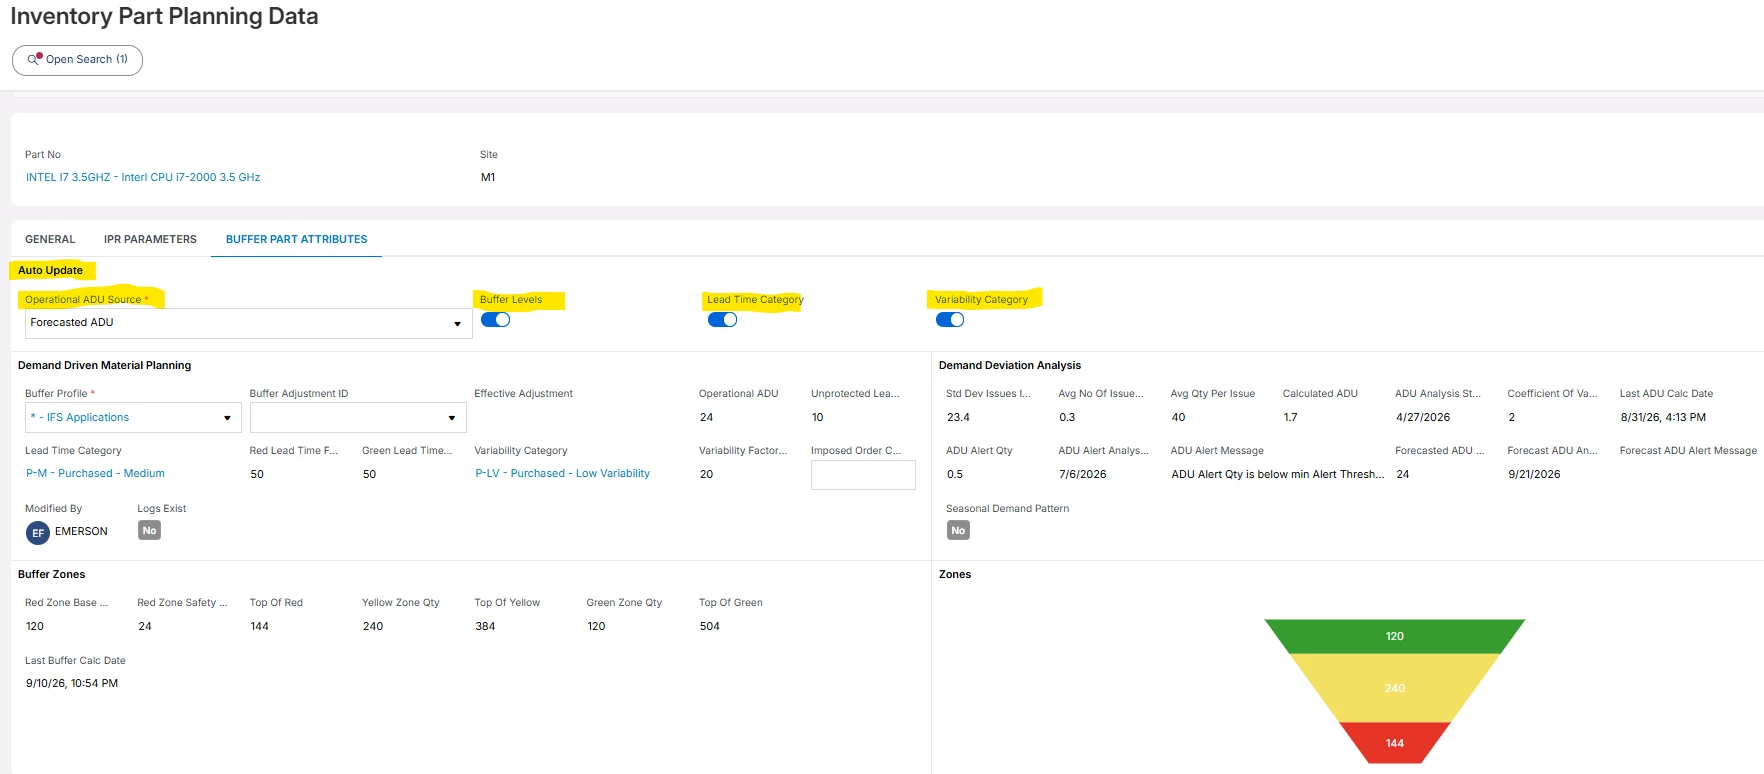
And within Inventory Part Planning Data page you have possibility to manually size your buffers. Could for example be very handy for new parts with no historical usage data.


Finally, I think it is smart to start up with purchased parts with pretty long lead times, and where these purchased parts exists in many parent parts.

Good Luck

-Mats