At the moment I manually collect dump files using task manager for RCA tasks, are there any recommended tools for automating this process?

Solved
Collecting Dumpfiles for RCAs
")
 +7
+7Best answer by Pranavan Paranthaman
Hi Dinuk,
You can use the ProcDump utility, it’s a command line tool that can be downloaded from https://docs.microsoft.com/en-us/sysinternals/downloads/procdump
It can be used to automate monitoring an application for CPU spikes, hang and crash due to unhandled exceptions and generate memory dump files based on required criteria.
Listed below are 3 common usage example scenarios of the ProcDump utility.
- Create dump based on CPU (-c flag)
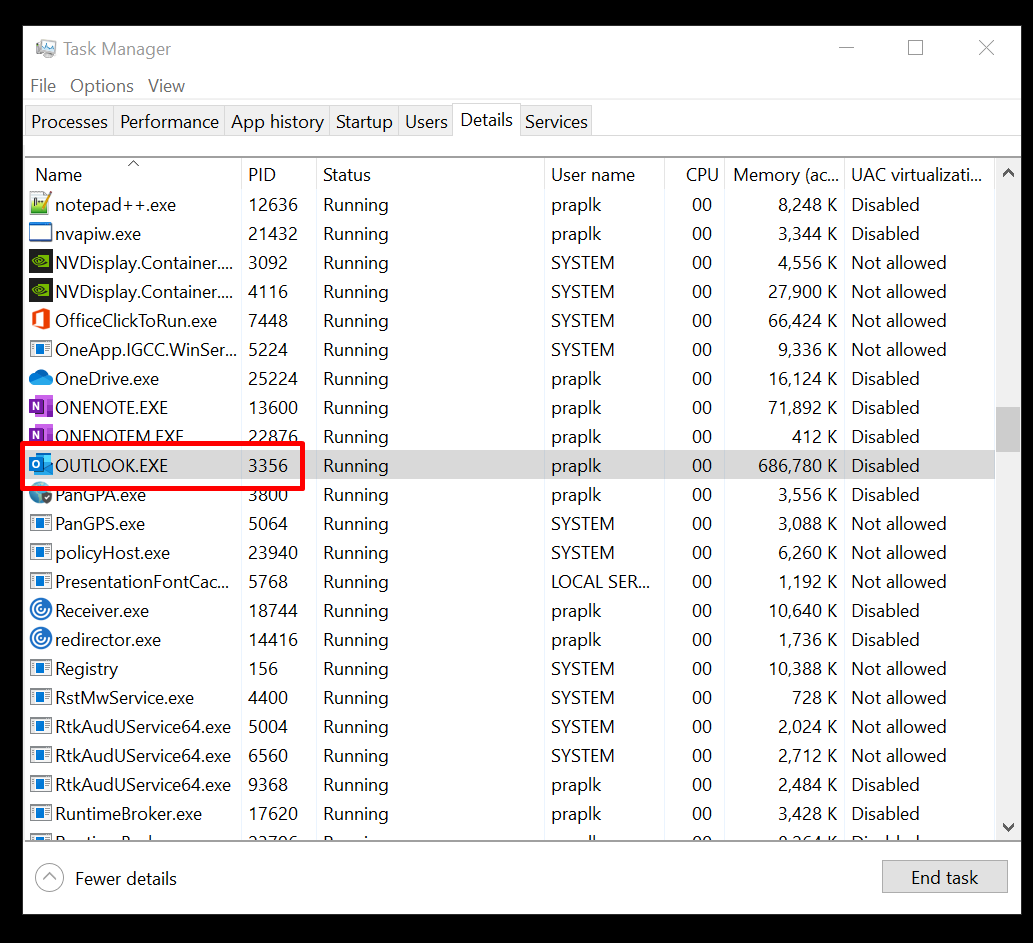
Obtain the process id (PID) of the application from the Task Manager.
Open Command Prompt as Administrator and run the following command.
C:\Tools\Procdump\procdump64.exe 3356 -ma -c 1 -s 1 C:\temp\
In this example scenario I’m monitoring the outlook application which has process id 3356 for spikes in CPU over 1% for more than 1 seconds. (Just to get a dump file created ![]() )
)
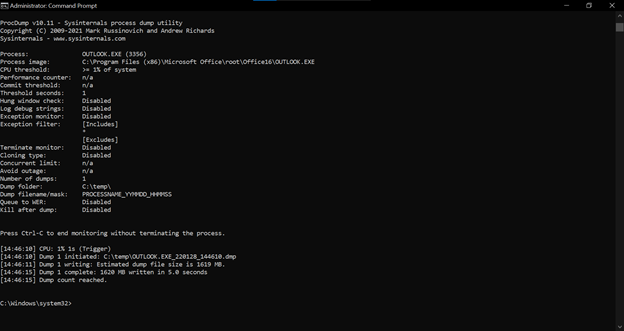
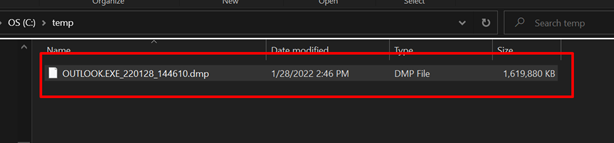
when that scenario is attained a dump file will be generated in the provided path (C:\temp\)
- To create dump file when an unhandled exception occurred (-e flag)
C:\Tools\Procdump\procdump64.exe 12345 -ma -e C:\temp\
- To creates dump file when a process is hung (-h flag)
C:\Tools\Procdump\procdump64.exe 12345 -ma -h C:\temp\

")

Reply
Enter your E-mail address. We'll send you an e-mail with instructions to reset your password.