I am experiencing an issue on the Resource Forecast Scenario screen where the output data remains at zero (0). As a result, the chart is not being displayed.
Could you please advise what master settings or specific data are required to make the chart display properly?
Best answer by desilvasachitha
Hello @RyoIchinose,
Please note that this behavior (of 0 output and no chart) is typically related to insufficient or unsuitable input data for the forecasting model.
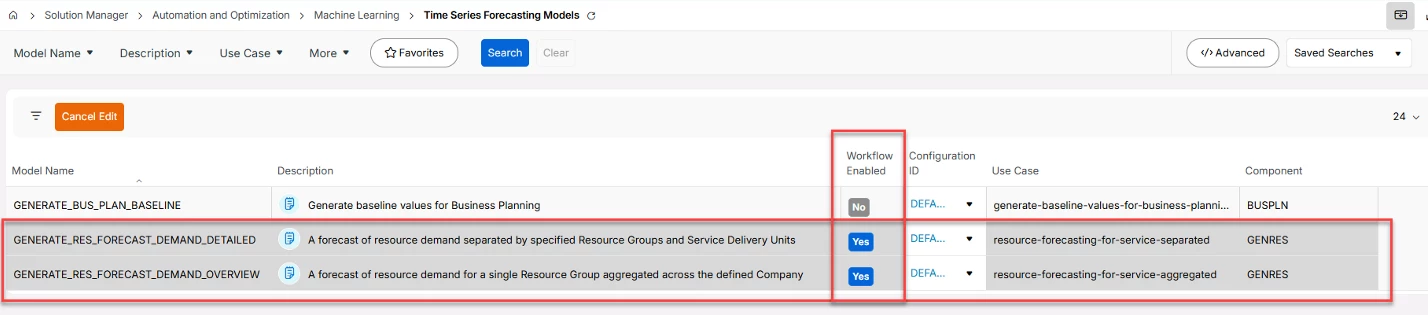
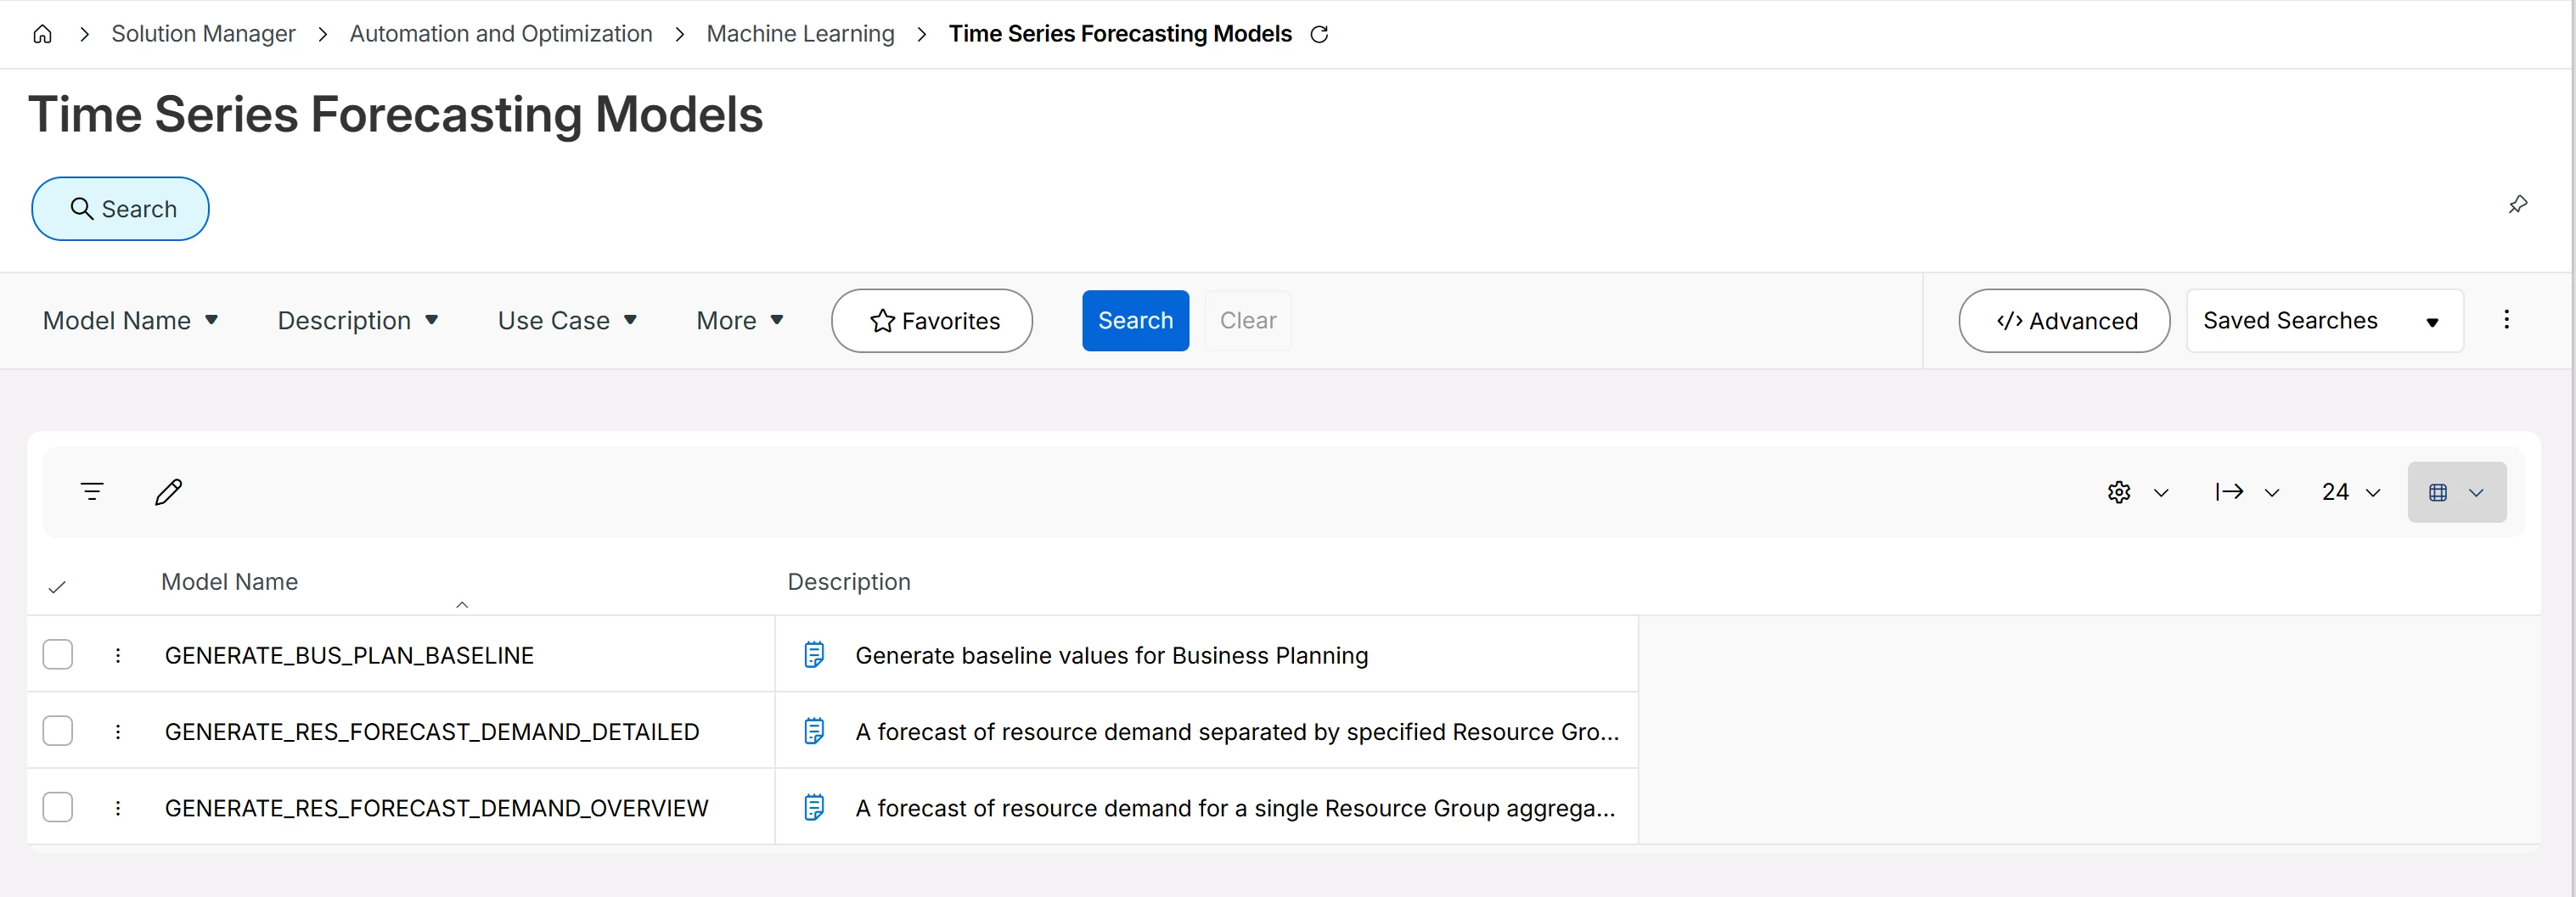
But you can first check if you have the following enabled under “Time Series Forecasting Models”.
Based on testing I’ve conducted myself and feedback I’ve gotten from IFS Product Development team. the Service Resource Forecast Scenario relies heavily on the underlying planned workload (historical time series data) from “Request Tasks” (and I've been informed that this will be extended to regular WT’s from 25R2 SU5).
As a result, if this data is not present or not meaningful, the model will only return zeros—hence no chart is displayed.
Here are some key things you could validate to see what has gone wrong.
Availability of “planned details” in the historical data - The model uses “Planned Start” and “Planned Finish” dates coming from Request Tasks in the selected “Input Period” when it attempts to extrapolate to future.
If no planned activities (request tasks) exist in the selected period then forecast = 0, this is often the culprit as i’ve encountered this multiple times myself.
Historical data availability and quality - The forecast is generated from historical patterns, not just configuration.
Meaning if you are selecting “2 year” as the input range = data from today going back 2 years from sys date will be considered. But there is no strict minimum data points within those 2 years that model needs to predict but Sparse or intermittent data often results in poor or zero forecast
so in practice, you need, consistent request task activity records (not large gaps) and enough volume to show patterns (weekly/monthly trends)
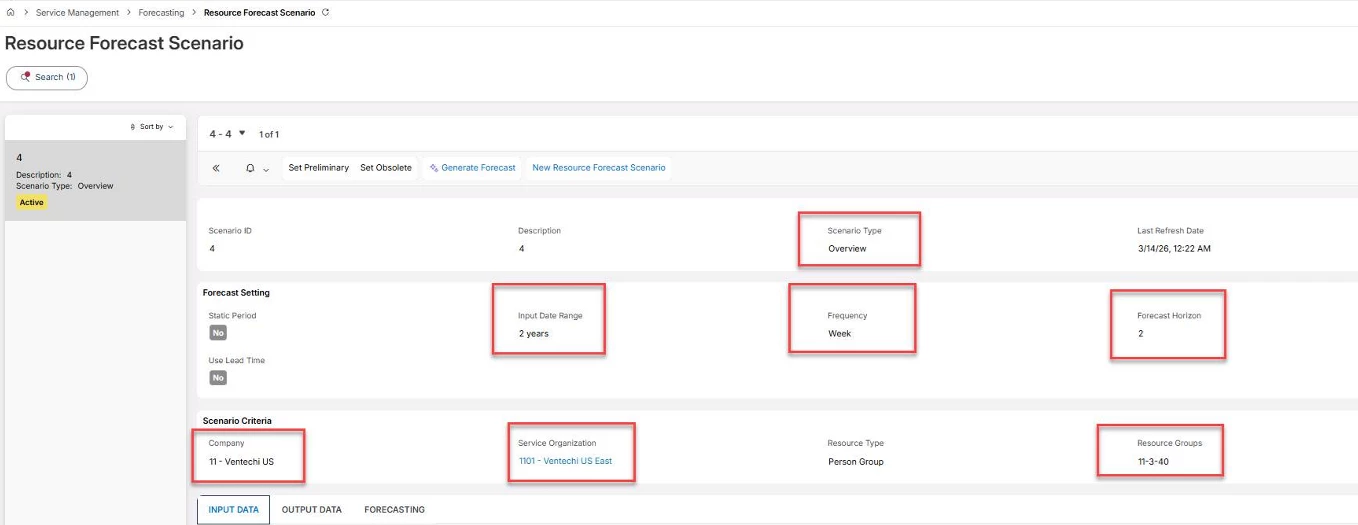
If user selects the following setup, it is important to note that model only considers 24 weeks in to the past, and doesn't consider entire 1 years' worth of data for the forecasting purposes.
Distribution of Data distribution - Even if data exists, you may still get zeros if your Data is too far in the past (outside selected input range), Aggregation level (resource group, frequency) results in mostly zero values and if you have Very few non-zero records (e.g., only a handful of request tasks even with planned start and finish dates)
Scenario design (frequency & granularity) - you need to understand that level of granularity impacts results where Daily forecasts require more data. On the other hand, If data volume is low you can try switching to weekly or monthly frequency. Moreover, “Detailed vs Overview” scenarios also influence how data is aggregated.
Need to make sure you have the correct data source (important limitation) Currently, the model primarily uses Resource activities linked to Request Tasks (with this being extend to regular WT’s from 25R2 SU5 - as per the information i was provided with the Product team)
So, if your organization is mainly using: Work Order Tasks / Maintenance tasks only, the model may not receive proper input data
Bottom line is that (if you have the workflows enabled as i’ve mentioned at teh very top) you do not need any additional “master settings” required. There are no hidden system parameters required to make the chart appear. If the input data is valid and sufficient, the chart will get automatically created. Most likely in your case the issue is with Input data quality.
Hope this helps.
@IFS Community I believe this question belongs in the IFS.ai Discussion section rather under “Proejcts” - It’ll make more sense if we can move this over there. Thanks!
Please note that this behavior (of 0 output and no chart) is typically related to insufficient or unsuitable input data for the forecasting model.
But you can first check if you have the following enabled under “Time Series Forecasting Models”.
Based on testing I’ve conducted myself and feedback I’ve gotten from IFS Product Development team. the Service Resource Forecast Scenario relies heavily on the underlying planned workload (historical time series data) from “Request Tasks” (and I've been informed that this will be extended to regular WT’s from 25R2 SU5).
As a result, if this data is not present or not meaningful, the model will only return zeros—hence no chart is displayed.
Here are some key things you could validate to see what has gone wrong.
Availability of “planned details” in the historical data - The model uses “Planned Start” and “Planned Finish” dates coming from Request Tasks in the selected “Input Period” when it attempts to extrapolate to future.
If no planned activities (request tasks) exist in the selected period then forecast = 0, this is often the culprit as i’ve encountered this multiple times myself.
Historical data availability and quality - The forecast is generated from historical patterns, not just configuration.
Meaning if you are selecting “2 year” as the input range = data from today going back 2 years from sys date will be considered. But there is no strict minimum data points within those 2 years that model needs to predict but Sparse or intermittent data often results in poor or zero forecast
so in practice, you need, consistent request task activity records (not large gaps) and enough volume to show patterns (weekly/monthly trends)
If user selects the following setup, it is important to note that model only considers 24 weeks in to the past, and doesn't consider entire 1 years' worth of data for the forecasting purposes.
Distribution of Data distribution - Even if data exists, you may still get zeros if your Data is too far in the past (outside selected input range), Aggregation level (resource group, frequency) results in mostly zero values and if you have Very few non-zero records (e.g., only a handful of request tasks even with planned start and finish dates)
Scenario design (frequency & granularity) - you need to understand that level of granularity impacts results where Daily forecasts require more data. On the other hand, If data volume is low you can try switching to weekly or monthly frequency. Moreover, “Detailed vs Overview” scenarios also influence how data is aggregated.
Need to make sure you have the correct data source (important limitation) Currently, the model primarily uses Resource activities linked to Request Tasks (with this being extend to regular WT’s from 25R2 SU5 - as per the information i was provided with the Product team)
So, if your organization is mainly using: Work Order Tasks / Maintenance tasks only, the model may not receive proper input data
Bottom line is that (if you have the workflows enabled as i’ve mentioned at teh very top) you do not need any additional “master settings” required. There are no hidden system parameters required to make the chart appear. If the input data is valid and sufficient, the chart will get automatically created. Most likely in your case the issue is with Input data quality.
Hope this helps.
@IFS Community I believe this question belongs in the IFS.ai Discussion section rather under “Proejcts” - It’ll make more sense if we can move this over there. Thanks!
Thank you for your response. I checked “Time Series Forecasting Models” in the 25R2 environment, but it seems I am unable to perform operations such as confirming “Workflow Enabled”.
Should I contact system support regarding this issue, or is it possible that my initial settings are incorrect? Could you please advise me on this?
Hello @RyoIchinose, Please note that the “workflow enabled” is not something that users can modify from the page “time Series Forecasting Models” page. If you take a closer look on my previous screenshot, i have it on “edit” mode and “work flow enabled” is a ready only field (display badge).
Moreover, my screenshot that showed “workflow enabled” was taken from 26R1 so you won’t see it in 25R2 unless you are in a very recent Service Update.
Let’s do this, in two steps.
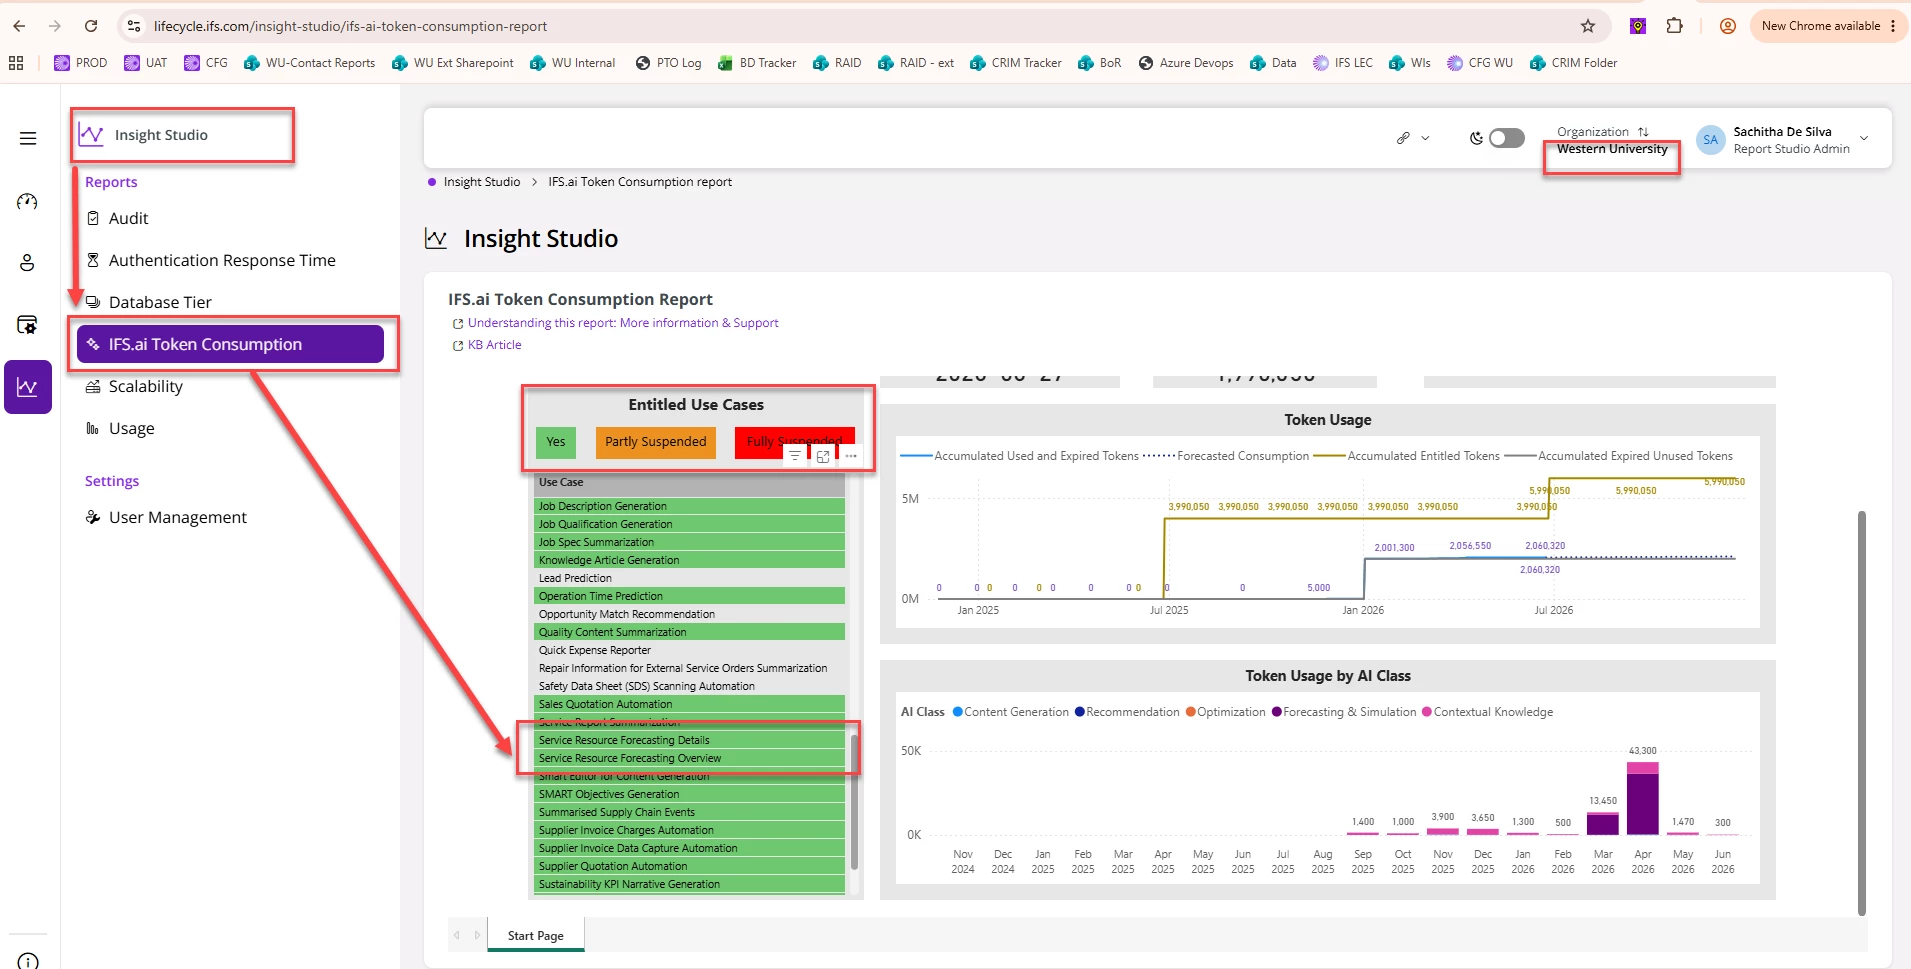
Validation #1 - Validate if you are subscribed and entitled to execute this use case Please get your system admin to check the “IFS.ai Token consumption” report (that can be logged in from “build place” > Insight studio > IFS.ai Token Consumption Report).
In this report you can check if you are entitled to execute this use case, if you see these two use cases marked in green, you should be able to run them.
If you need more information on how to access the token consumption report, please see one of my earlier questions on this topic.
If the Step #1 is ‘yes’ both use cases are marked in green (entitled to execute) let’s check validation #2
Validation #2 - Data Consistency issue preventing Graph generation in “Forecasting” tab If you are in a version before 25R2 SU5 the input data will only consider “Request Tasks” with Planned Start and Finished Dates set on them.
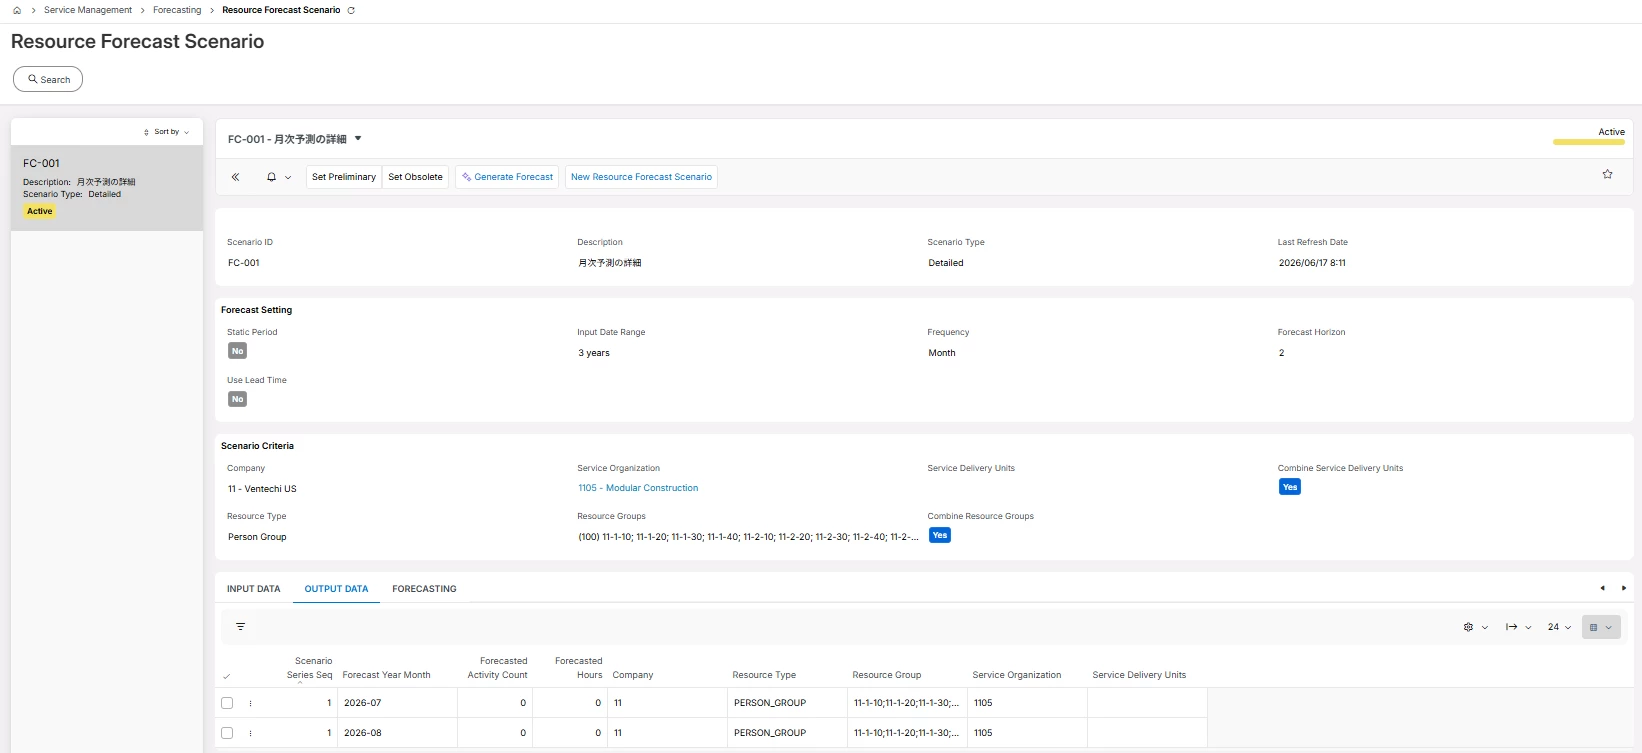
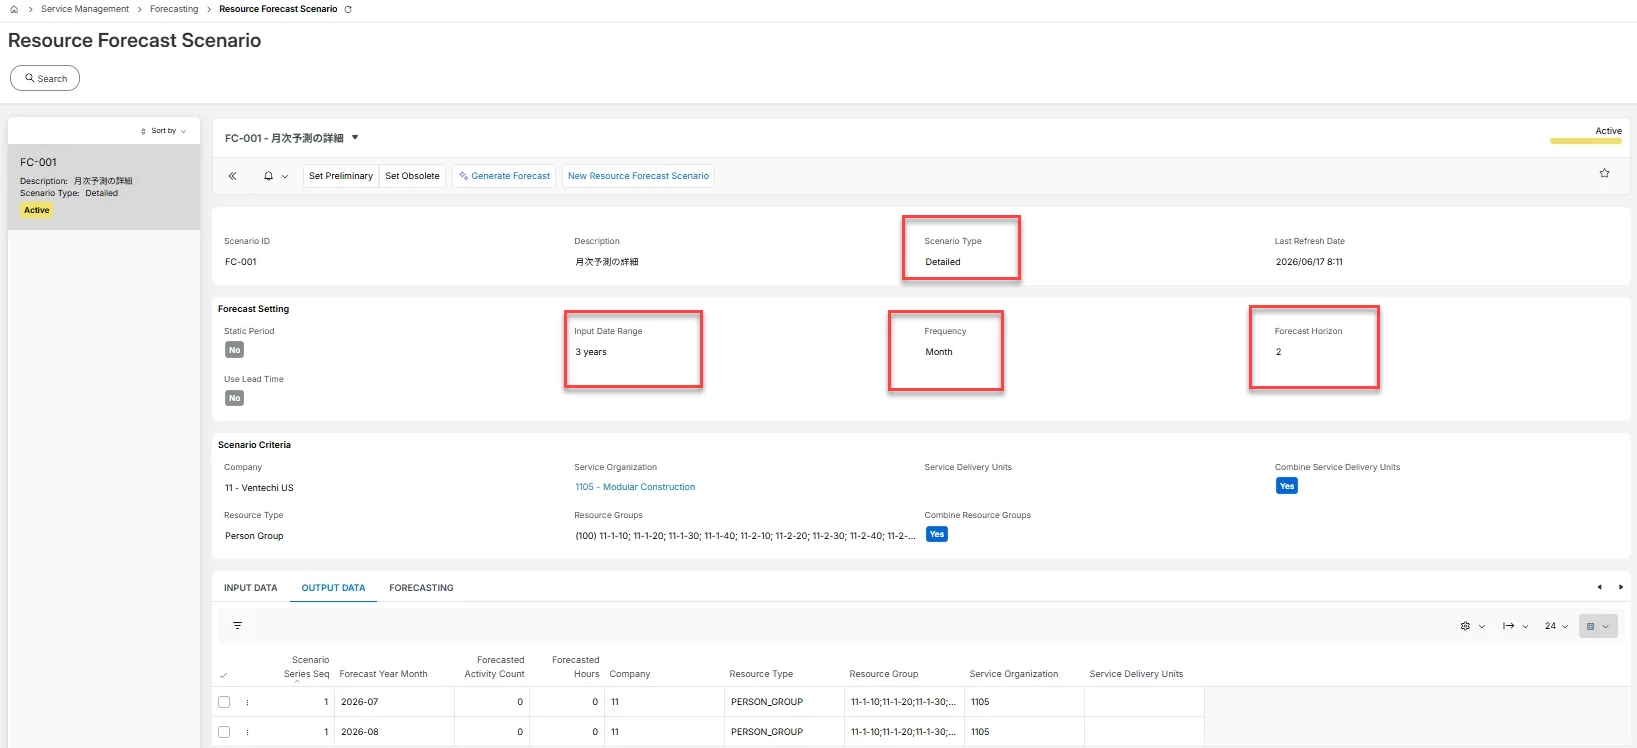
In your screen capture (I've extracted from your post above) you have included Input Data Range = 3 years and the Frequency = Month while the Forecast Horizon is for = 2 months.
But we need to check if you have any data available in the system that model considers as eligible to extrapolate forecast values for the 2 months in to the future (for the selected resource groups).
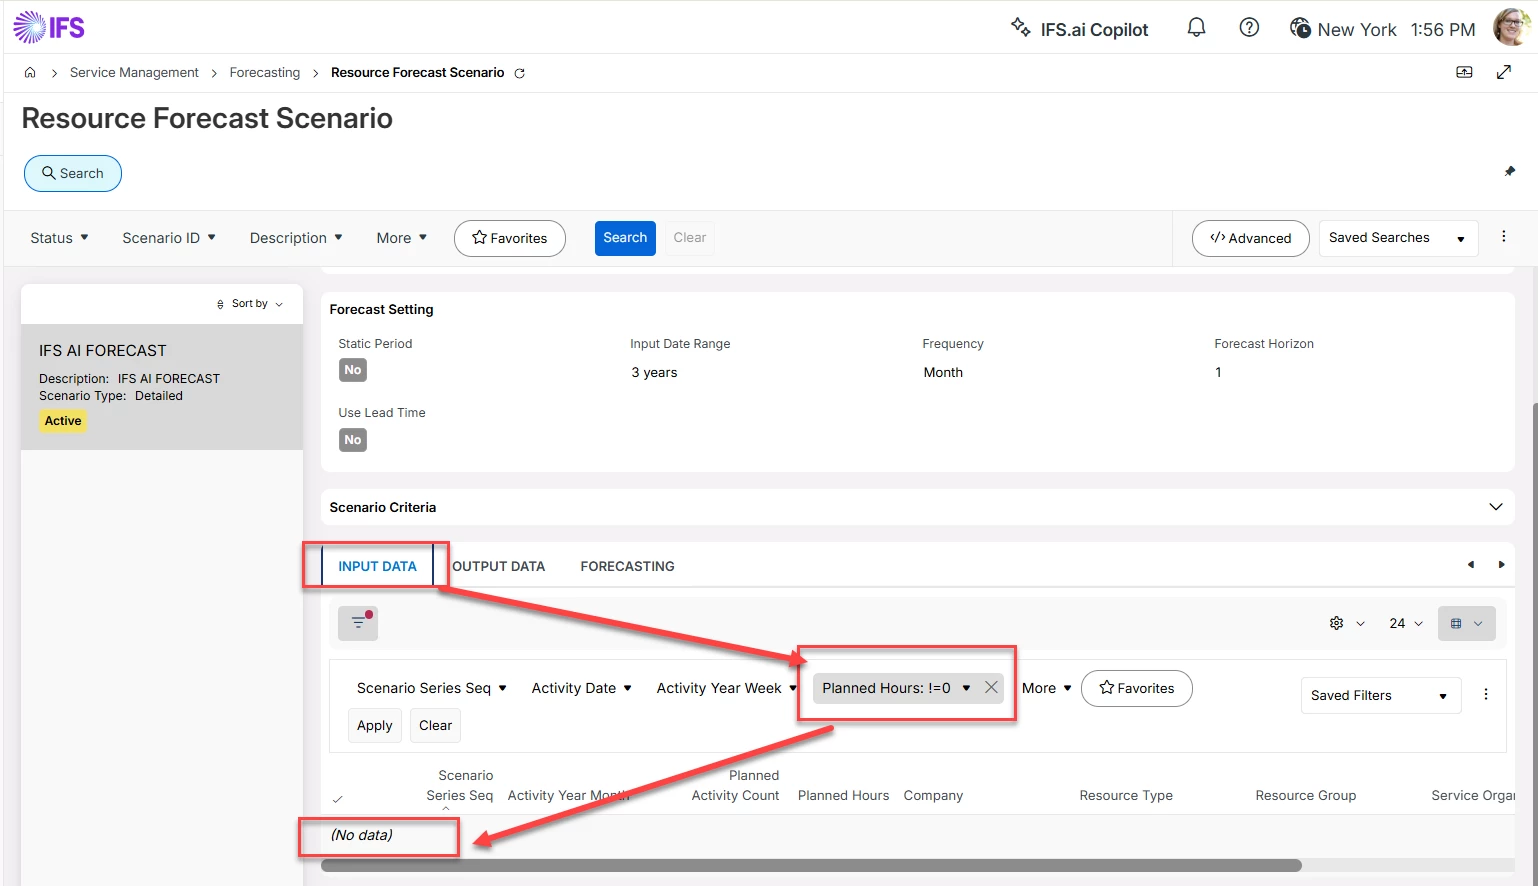
Please go to the “Input Data” tab and in the “Planned hours” column (values in this field are what is driving the model) check if you have any records (coming from Request Tasks) that have any planned hours (more than 0). If you find no records in here, then that explains why the ‘output data’ and ‘Forecasting’ tabs do not have values (not because you are missing any setups, system parameters but purely because you lack data).
Please do the above two tests and le me know how it goes, based on your validation results we can determine where we should be going.
I will reach out to our system administrator to check on this. Since I am not an engineer myself, I may not fully understand all the technical details, so I might need to ask you more questions later.