When I create an SPC chart, it seems that the system only considers the measurement result from result number one. Why isn't the average of all result numbers of a data point of an analysis taken into account?
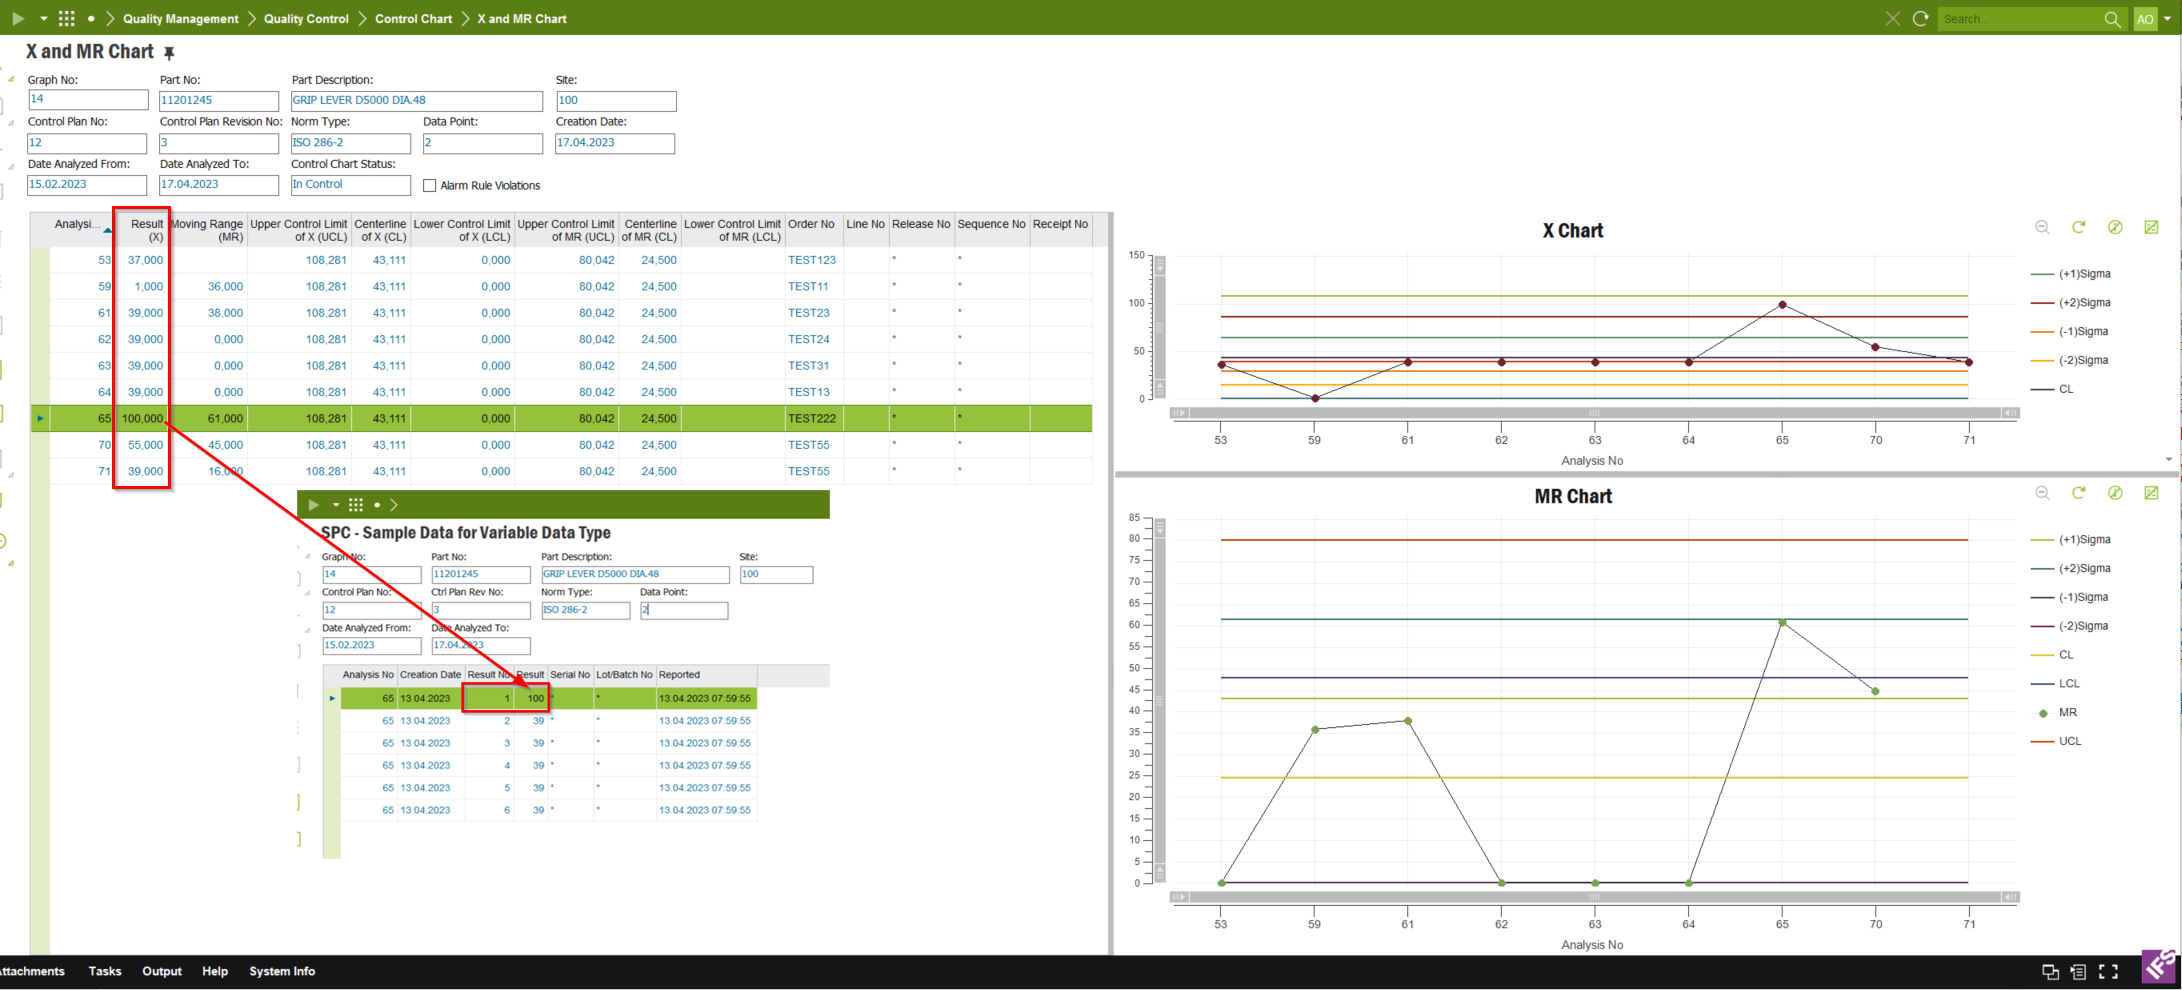
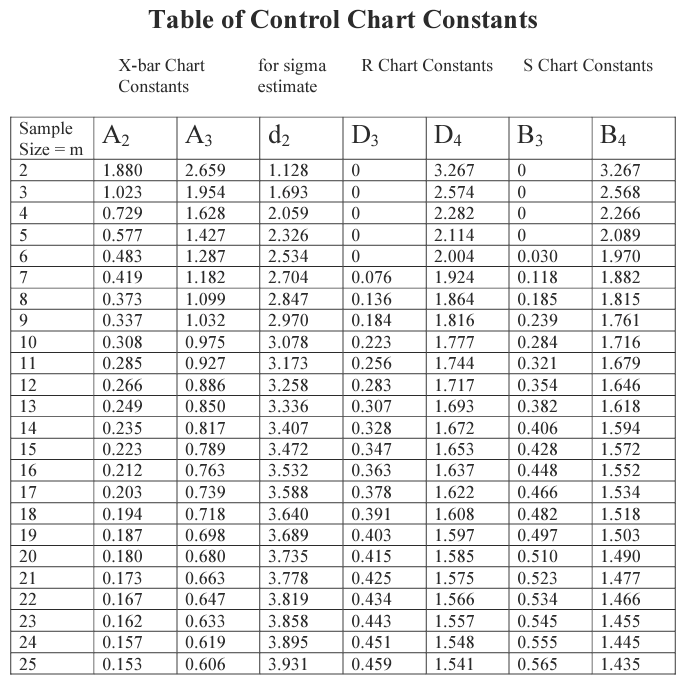
In my view, this should be (100+39+39+39+39+39) / 6 = 49.167
Could anyone please help me resolve this issue or advise me on how to proceed?
Best answer by Peter Lundgren
You are using a “X & MR” - chart. These are used for individual measurements, i.e. when the Sample Size = 1.
“Xbar & R” or “Xbar & S” charts are used when the sample size is fixed and > 1. However to be able to use these chart types the data point needs to have an Inspection Code with Inspection Type = “Quantity”
System only considers the first time result of each analysis as X value and average of first 3 consecutive values for MR. Hence you are getting this value and for average you need to use X bar charts.
Thank you very much for your quick responses! It helped me a lot, but now a new problem has arisen...
When I create a new inspection plan and set it to "Quantity" and set a sample size of over 25, I receive an error message that the inspection quantity is greater than 25 and therefore no SPC chart can be created.
Is there a way to change this, or am I simply not allowed to have a sample size greater than 25?
SPC is a tool/methodology used to predict the future performance of the monitored process. You inspect a sample of the produced parts and then the SPC logic do all the calculations. A bunch of different hard-coded control chart constants, like A2, A3, D3, are used in the formulas to calculate/create the SPC Chart. The values for these constants are dependent on the sample size.
Typically you use sample size = 4 or 5 when creating control charts for variables, but as you can see in the picture above, sample size up to 25 is supported, but sample size > 25 is not supported. If you have a shop order with long lead time and/or a huge lot size I would recommend (from a SPC perspective) creating several Analysis (with a small sample size) for the operation of interest.
We use 3 different kinds of cookies. You can choose which cookies you want to accept. We need basic cookies to make this site work, therefore these are the minimum you can select. Learn more about our cookies.