Hey guys,
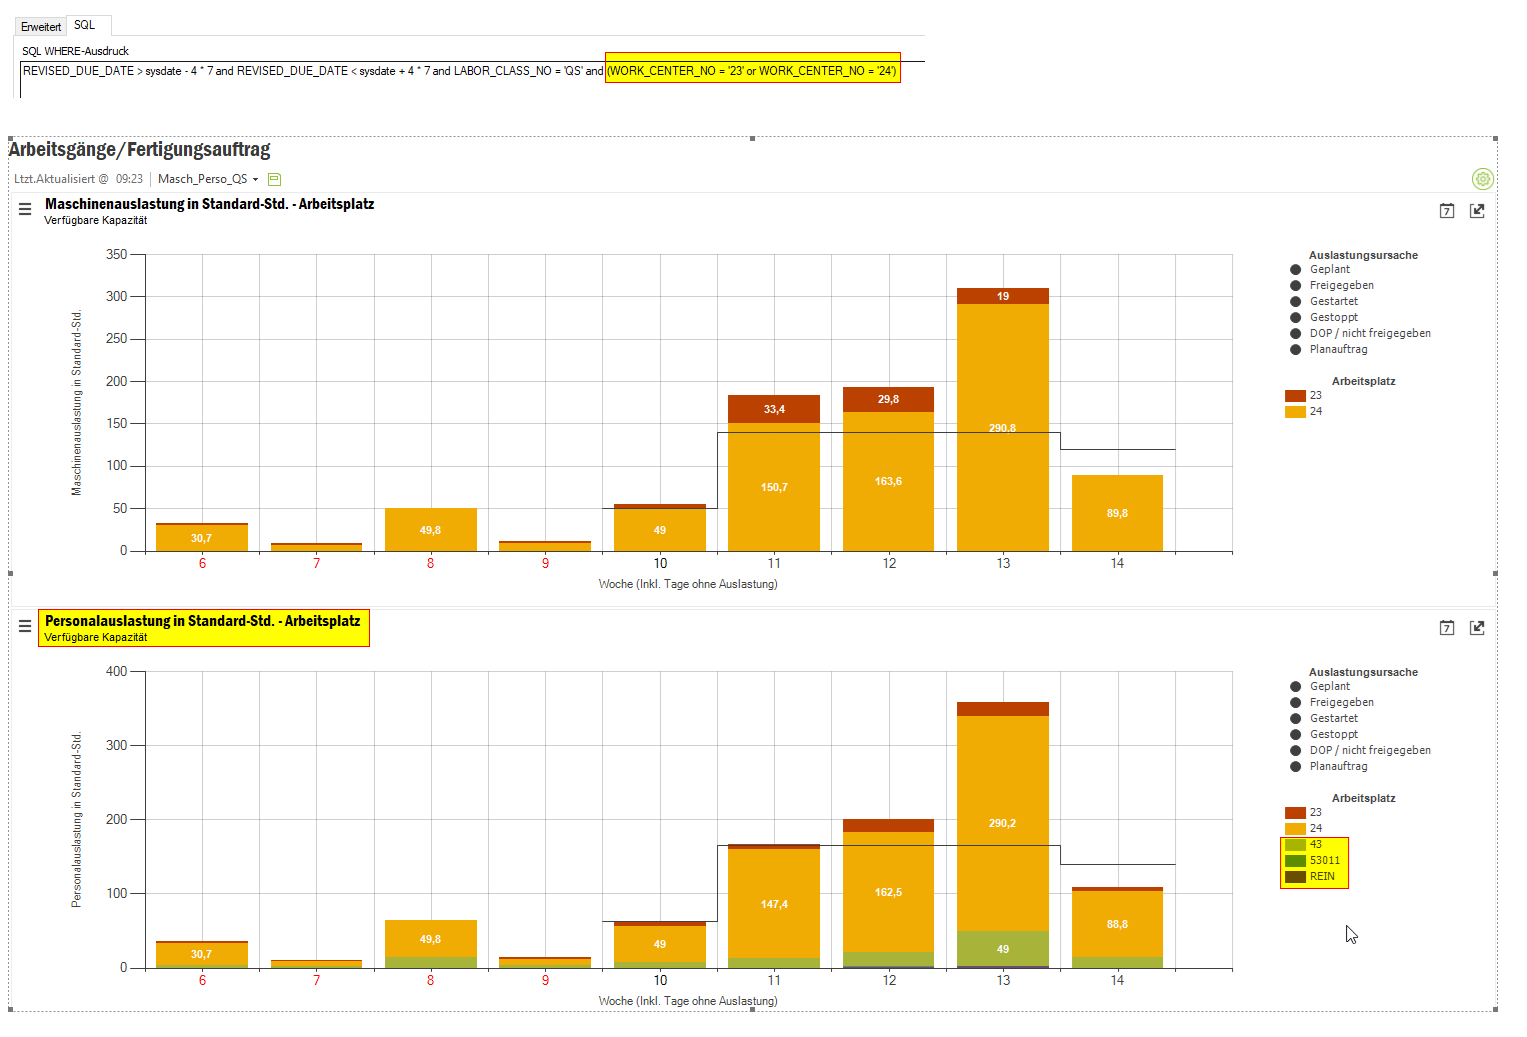
Have you also experienced some discrepancy between manufacturing visualizer and the table content? For example the filter is set to only include work centers 23 and 24. The machine productivity chart follows those filter criteria but the labor productivity (bottom bar chart) does not. It includes further work centers which were not selected in the filter criteria in the first place.
Any explanation for that? Thanks