

Hello,
I am trying to create a reports using Assyst. Information I need is:
- Number of tickets in a given month
- Distribution of tickets among individuals
- Average time to resolve a ticket
- How many are currently open and since when.
I started with the simple Event Monitor using a query providing all Incidents from the beginning of this year, however the chart for some reason provides data only until February.
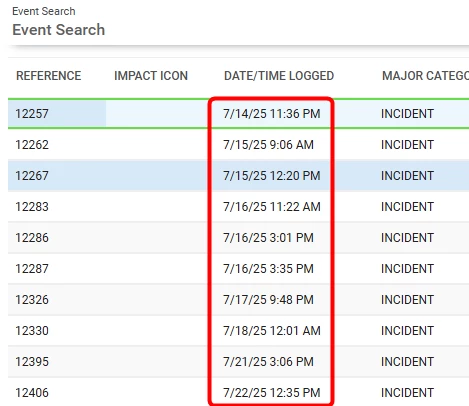
I am using Date/time logged, where below you can see I have a data from e.g. july this year:
And the chart provides this:
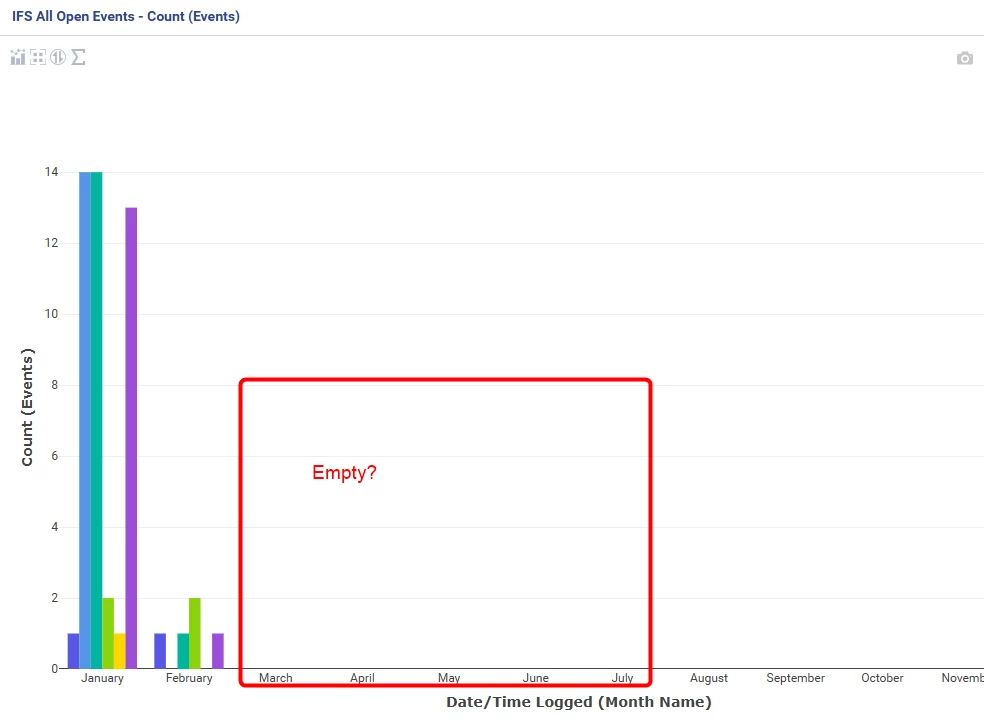
Any idea why?
And also how else I could get the report providing me all details I had mentioned at the beginning?
Thank you very much in advance for your help.