Question

Lobby question

  • February 26, 2025
  • 2 replies
  • 56 views

Forum|alt.badge.img+10
  • Sidekick (Customer)

Hello,


I created bar chart which display on the X axis all order_no and on Y axis Remaining Qty. 

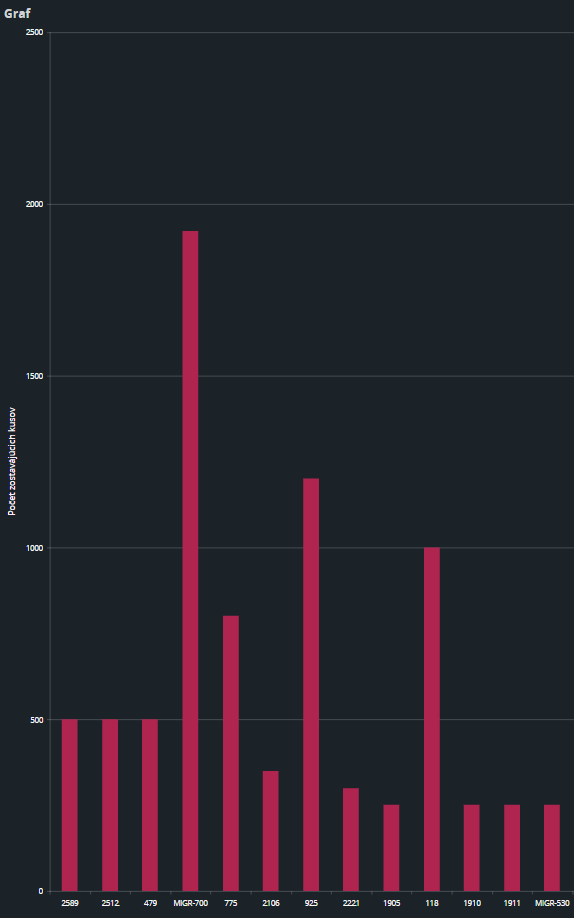
but I want to add option for fitering, for example I will add one order_no and after that it will display on Y axis lot of properties, like green column for remaining qty, red column for planning qty, how can I achieve this?


Thanks

2 replies

Forum|alt.badge.img+14
  • Superhero (Partner)
  • March 4, 2025

Forum|alt.badge.img+10
  • Author
  • Sidekick (Customer)
  • March 5, 2025

Ok, thanks. And is somehow possible automatically or manually print these graphs? I want to create some automatic or manual system, probably with some button, if someone will click on this button, this whole loby with lists and graphs - all elements will be send to some emails and this user can print this loby, it is possible to make this system?