Solved

GRAFANA dashboard details for POD CPU & Memory usage.

  • 15 September 2023
  • 1 reply
  • 460 views

Userlevel 1
Badge +5

Hi Experts;

  • When we check Middle Tier Server performances using GRAFANA dashboards to check POD wise CPU & Memory utilization , below were observed


Dashboard used : 

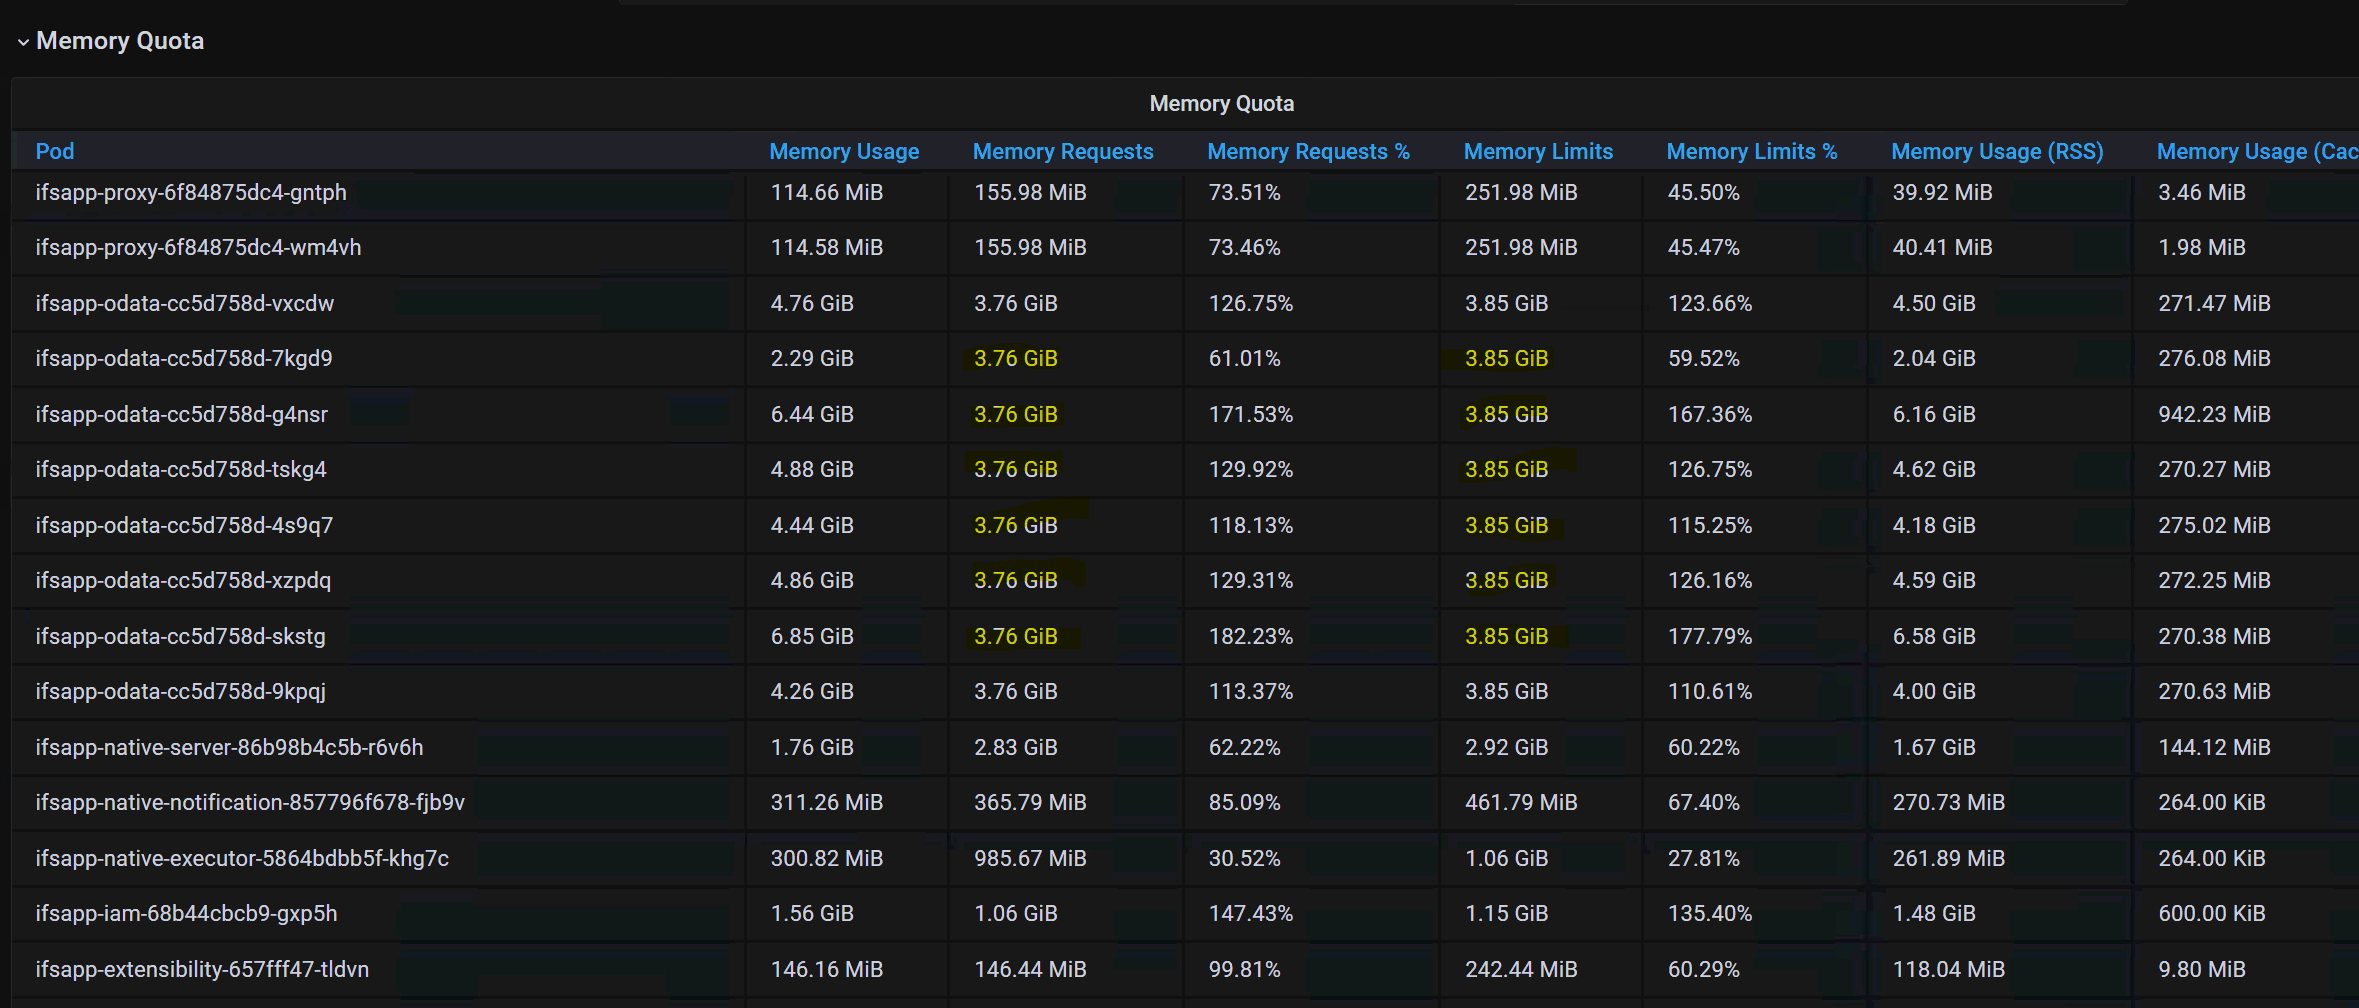
  • Even under normal conditions, some PODs have  ‘MEMORY REQUESTS ~ MEMORY LIMITS’  as in above image.

QUESTION :-

  • Does that mean these pods are fully utilized [memory] even under normal conditions ?
  • Here MEMORY USAGE is always higher than MEMORY REQUESTS & MEMORY LIMITS.Is that a cumulative value or else?
  • Should we mention that as a concern to consider when we give recommendations/ suggestions based on these details/behavior.


BR!

Dilshan

icon

Best answer by TheofilLepschy 12 March 2024, 16:29

View original

1 reply

Userlevel 1
Badge +6

Hi @Dilshan Aththanayake,

Memory Request - defined value which the pod reserve for him self

Memory Limit - max value of memory which can be used.

To your Questions:

  1. Memory Usage is the value what the pod is really using;
  2. Strange that in your example Memory Usage > Memory Limit. Theoreticaly should not be allowed to be used more as the limit. I would say, this is a indication to start more ifsapp-odata pods. 
  3. Yes

More explanation about Memory Requests & Limits:

Resource Management for Pods and Containers | Kubernetes

BR

Theo


Reply