Solved

TRENDS FOR AGING DISTRIBUTION ORDERS

  • January 25, 2021
  • 1 reply
  • 76 views

Forum|alt.badge.img+7

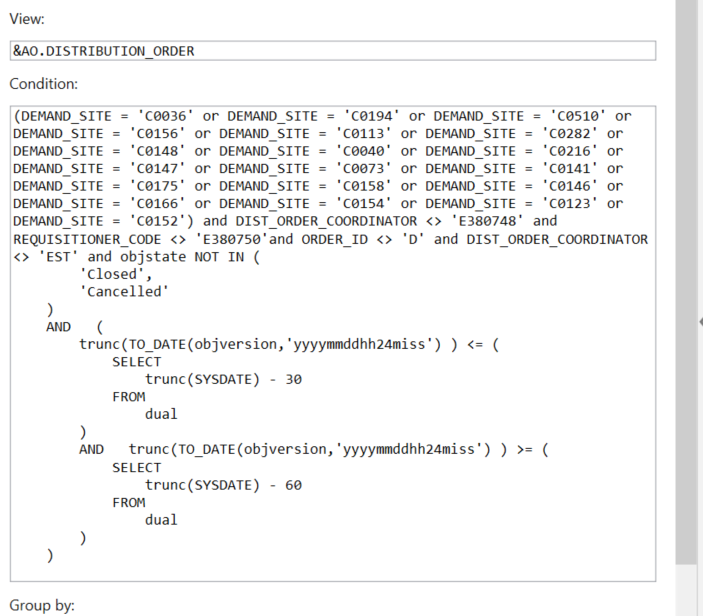
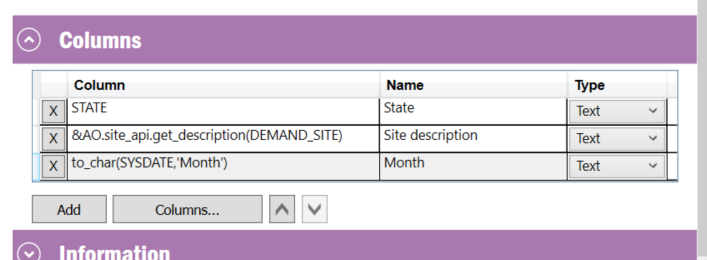
I am trying to see if i can set up graph for trends for our aging DO’s and it is not working for me, i have the data set for my aging DO’s but want to see the rise and fall by month, currently when i try it, it pulls it by only the obj status date, i am trying to see if i have 30 in jan and then 20 in feb and 40 in march for example. thank you in advance for any help, below is the data set i am working with


Best answer by paul harland

a couple of things for starters:

Objversion is not a great column to use as your date.  Better to use a created_date, due_date or whatever the system has.

You will need Columns representing your aging buckets.  These do not belong in your Condition (where clause).  The condition should return all dates;

Your first column will be like

Case when <date> between sysdate-60 and sysdate-30 then 1 else 0 end “60days”

Your second column will be like

Case when <date> between sysdate-30 and sysdate then 1 else 0 end “30days”

and so on.

This topic has been closed for replies.

1 reply

paul harland
Superhero (Employee)
Forum|alt.badge.img+24
  • 547 replies
  • Answer
  • January 26, 2021

a couple of things for starters:

Objversion is not a great column to use as your date.  Better to use a created_date, due_date or whatever the system has.

You will need Columns representing your aging buckets.  These do not belong in your Condition (where clause).  The condition should return all dates;

Your first column will be like

Case when <date> between sysdate-60 and sysdate-30 then 1 else 0 end “60days”

Your second column will be like

Case when <date> between sysdate-30 and sysdate then 1 else 0 end “30days”

and so on.