Question

Perform ABC, Frequency and Lifecycle Classification

  • 11 March 2021
  • 7 replies
  • 1016 views

Userlevel 3
Badge +6

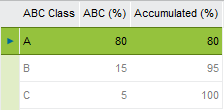
I ran Perform ABC, Frequency and Lifecycle Classification for the first time in a test environment.  We have been on IFS for 15 months.  A majority of our items changed to C even though Inventory Basic Data is set to 

I aggregate inventory every month.  Is there anything else I need to do before running Perform ABC, Frequency and Lifecycle Classification?  Do I need to close Statistics Periods?  Is there any way to print the logic that was used in calculating the new ABC code?  This is our first time doing this and I’d like to this information for documentation purposes and for audit purposes.


This topic has been closed for comments

7 replies

Userlevel 7
Badge +28

/ifsdoc/documentation/en/Invent/dlgPsheetClassifyInventoryPart.htm


/ifsdoc/documentation/en/ProcessModels/Process_Model/calculateplanningdata.htm


ABC Analysis

ABC analysis is a classification of parts in descending sales volume order. Parts sorted in this way are classified as either A, B, or C parts, A-class parts being highest in value and C-class parts being lowest in value.

The purpose of the analysis is to identify the Inventory parts that are contributing the most to the total sales volume so that the ordering of A-class parts can be controlled to ensure both high service levels and low inventory levels. Less concern is required for lower-value parts. You determine which classes, representing what percentages of sales volume, the analysis will address. This data is specified in Inventory Basic Data/ABC Classes. This calculation is not carried out for configured parts.

For ABC calculation, these parameters are required:

  • Site
  • Cost set
  • Number of periods

ABC analysis calculates the ABC value of each part, for the specified site ID and cost set, by multiplying the quantity issued during the specified number of periods by the part's inventory unit value. The records are then sorted and classified in descending order of volume value. The calculation runs against optional cost set. Each part's ABC Class Code (in the inventory part register) is updated automatically.


For ABC Class, there a setting that is defaulted on all sites initially


The Frequency Class operates off of a parameter that can be selected to control the move from 

Slow Mover to Medium Mover, and from Medium to Fast.


Userlevel 7
Badge +28

I also found this bit that I had tried to use to explain my understanding of the behavior at one point.

Help is a bit vague on this point.


However, based on the below explanation on how the calculation is performed – the number of periods are specified for the calculation, then the following output is achieved per part


ABC Value = usage per period X inventory unit value

Arrange list in descending order


My presumption – unverified – is that according to the above settings, Class A would be assigned to the top 20% of the items appearing in the list based on ABC Value (not just inventory unit value), Class B would be assigned the remaining items with usage during the period.  Class C would remain for the items with no usage.

Userlevel 7
Badge +28

And one more - this is from the last time I ran it on a site, I found it pretty unhelpful.

It detects the largest ABC value to be our largest cost and highest volume machines leaving only a dozen items to get classed as A because they make up the 20% of the calculated ABC value.  This is not the same as inventory value.

The counts look like this now.


So other than telling us the C items had no usage all we know is the other items that had usage were B items.  There are 19454 C items with quantity on hand, however 17890 of them are drawings so that doesn’t mean anything, another 400 or so are expensed hardware items, also don’t matter.  Leaving 1163 items with Quantity On Hand and Class C.  That might be the only interesting group to look at as they should be no usage items, but at a glance, the majority are non-expensed hardware, resistors, capacitors, and manuals.  After eliminating the clutter, the group seems to be less useful.

The above numbers were 20%, 80%, 0% I believe.

I changed the parameters to 60% A 35% B and 5% C later which changed A to 143, for reference.

Userlevel 3
Badge +6

Thanks for all the info Shawn.  It’s disappointing how vague Help is given the importance of ABC codes and cycle counting.  I performed an ABC code revaluation in our test environment and did not get the results I expected.  If I could find the usage per period I could then try to recreate what IFS did.  I haven’t been able to find the usage per period though.

Userlevel 7
Badge +28

Have you checked out Average Issues/Receipts per Period?  it is by part number, but should give you the underlying number.

Userlevel 3
Badge +6

That’s a big help!  Thx again Shawn.  Now I just wish I could get all the information in one screen for all part numbers instead of a separate screen for each part number.  That way I could export to Excel and do a quick analysis.

Userlevel 7
Badge +28

Yeah, the only way you can do that is to use the SQL Query Tool from this window and table.