Solved

Is it possible to add visualised charts in a lobby? IFS 10

  • April 9, 2021
  • 2 replies
  • 398 views

Forum|alt.badge.img+8

Hi,


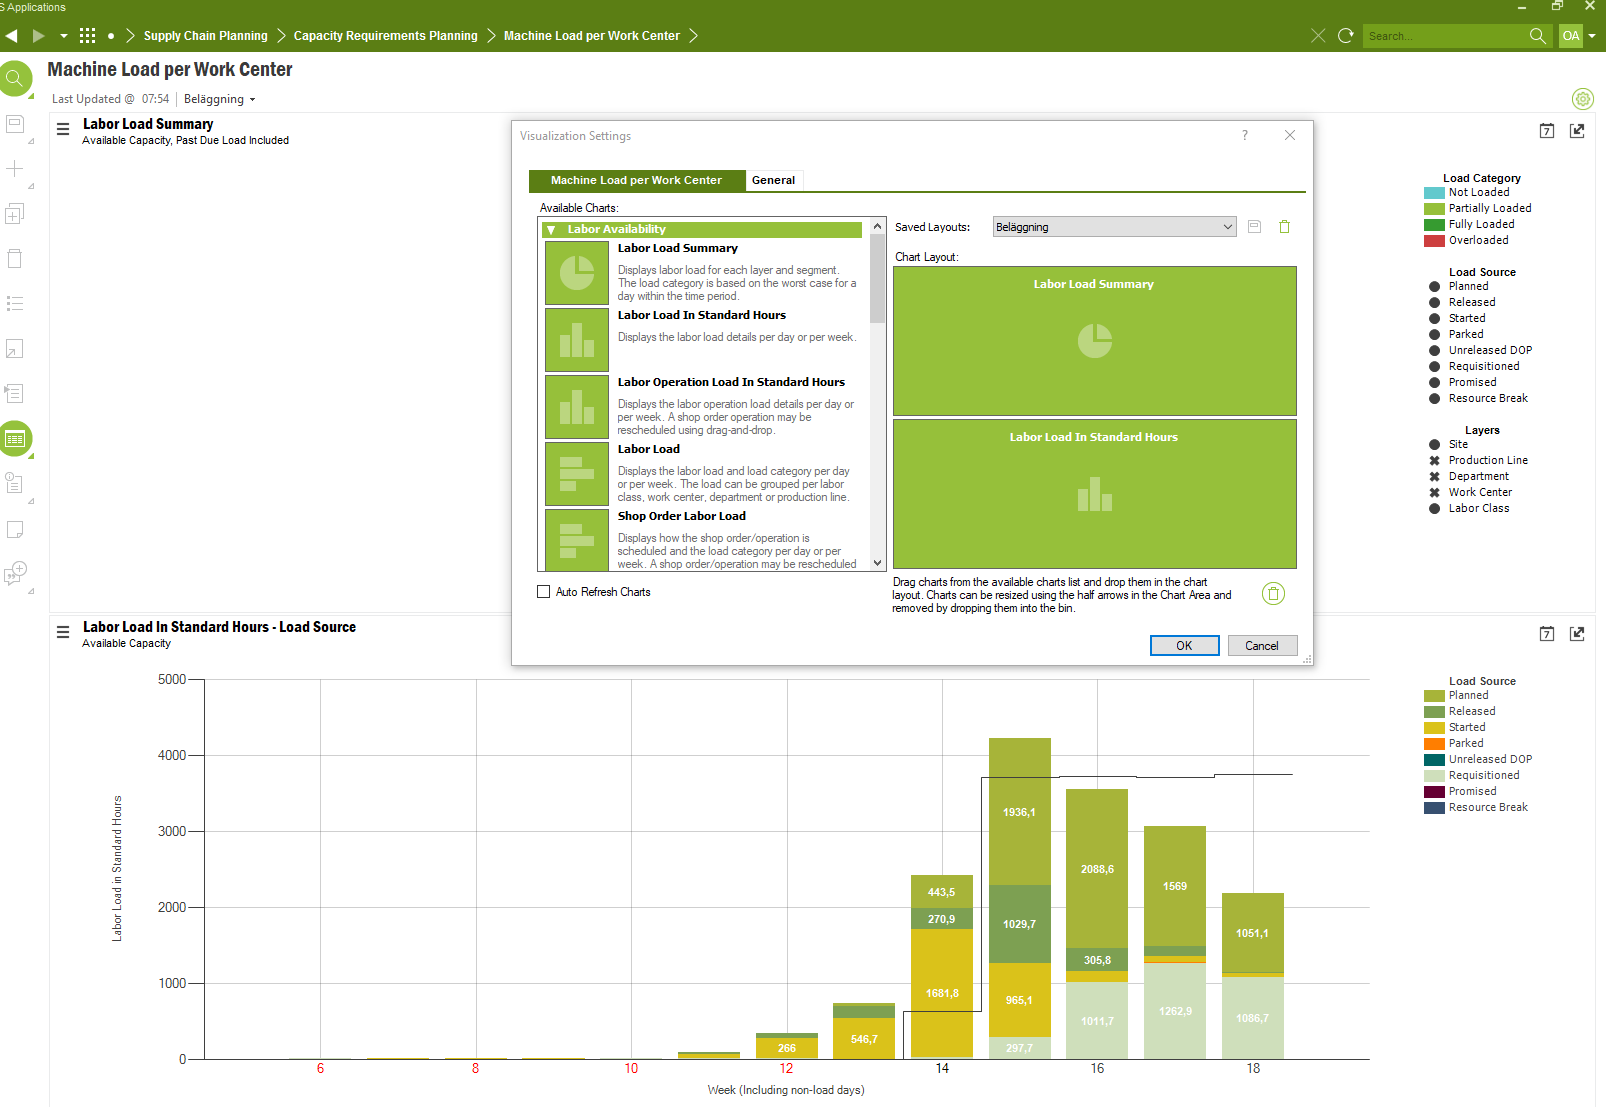
Would it be possible to add charts like below into a lobby? How?


Best answer by Piumi Rubasinghe

Hi @LundahlOskar,

Yes it is possible. First you have to create a Lobby Data Source and then Create a Chart type Lobby Element using that Data Source. There are several types of chart elements available such as Pie Chart, Bar Chart and Line Chart.

You can also find more information from F1 Documentation as well.

Thank you.

This topic has been closed for replies.

2 replies

Piumi Rubasinghe
Hero (Employee)
Forum|alt.badge.img+14

Hi @LundahlOskar,

Yes it is possible. First you have to create a Lobby Data Source and then Create a Chart type Lobby Element using that Data Source. There are several types of chart elements available such as Pie Chart, Bar Chart and Line Chart.

You can also find more information from F1 Documentation as well.

Thank you.


Forum|alt.badge.img+8
  • Author
  • Sidekick (Customer)
  • April 9, 2021

Thanks, Im aware of the lobby element types. I just thought it would be greate if I could use the charts as pre defined in the visualization view and their functionality.

So i consider the answer to my question to be no.