Question

IFS Cloud Web DevTools - Product information/support

  • August 28, 2024
  • 6 replies
  • 462 views

Forum|alt.badge.img+6
  • Sidekick (Customer)
  • 20 replies

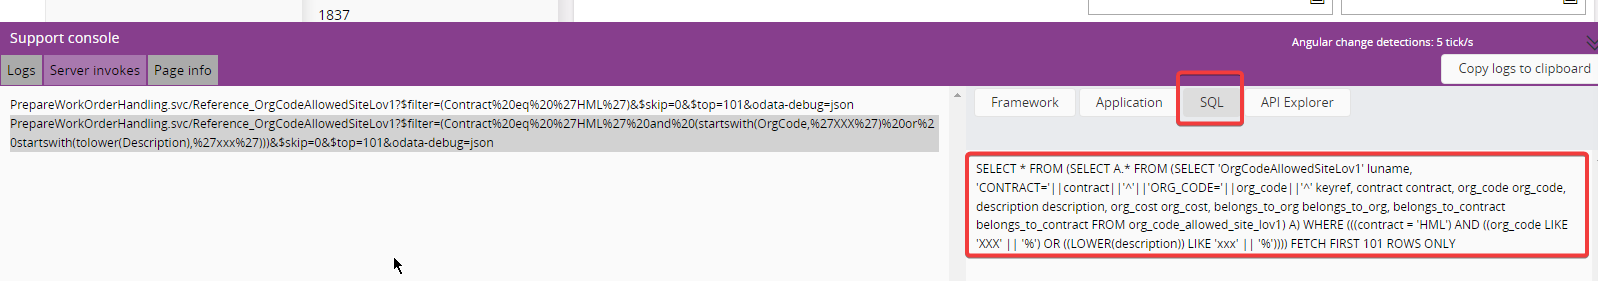
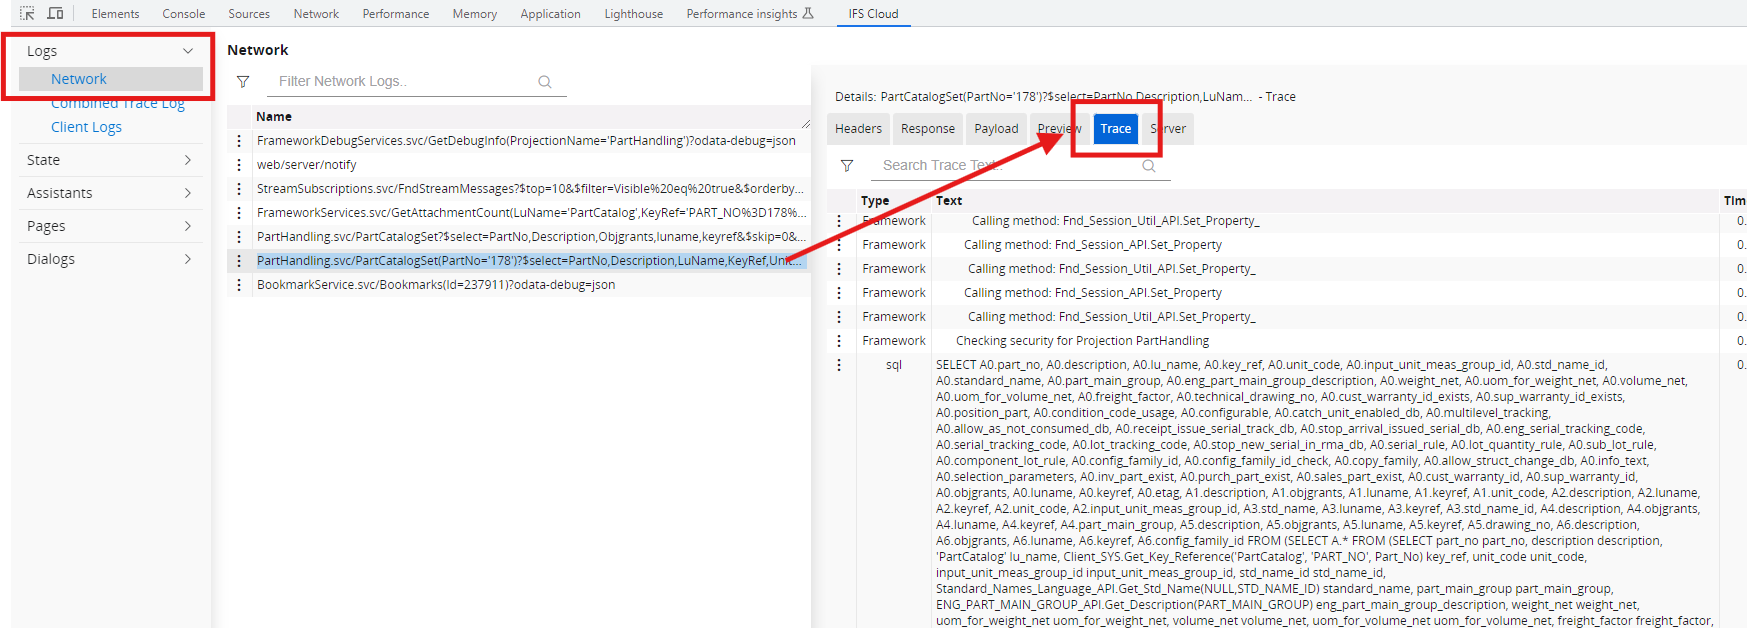
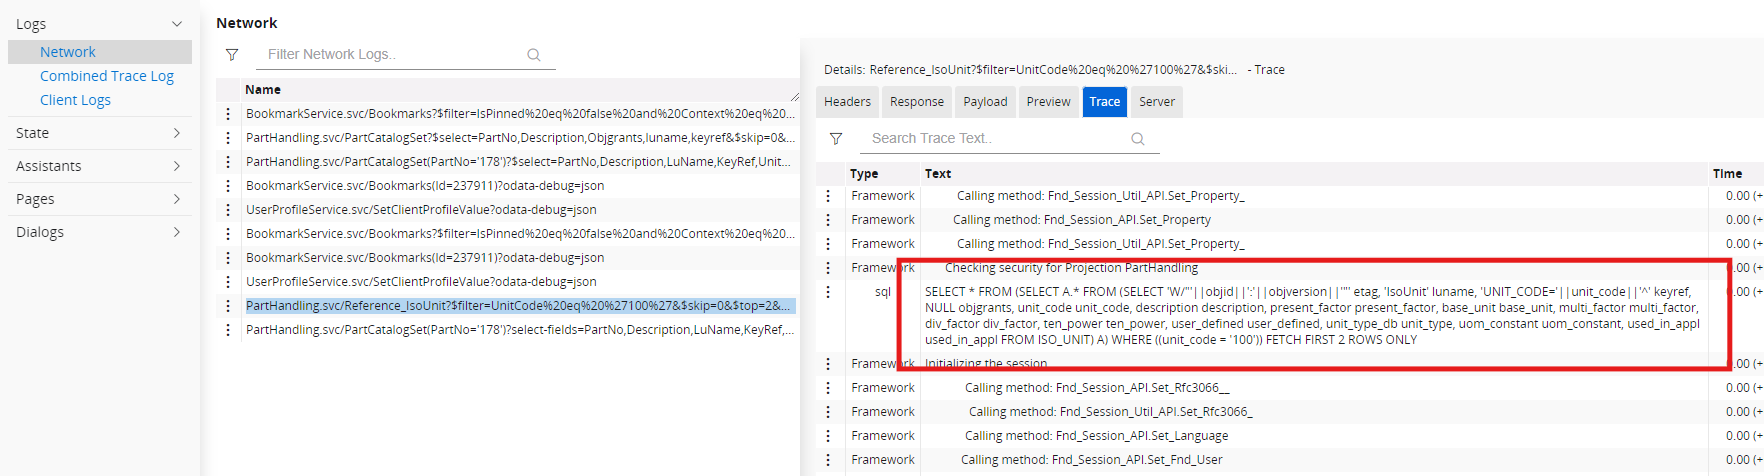
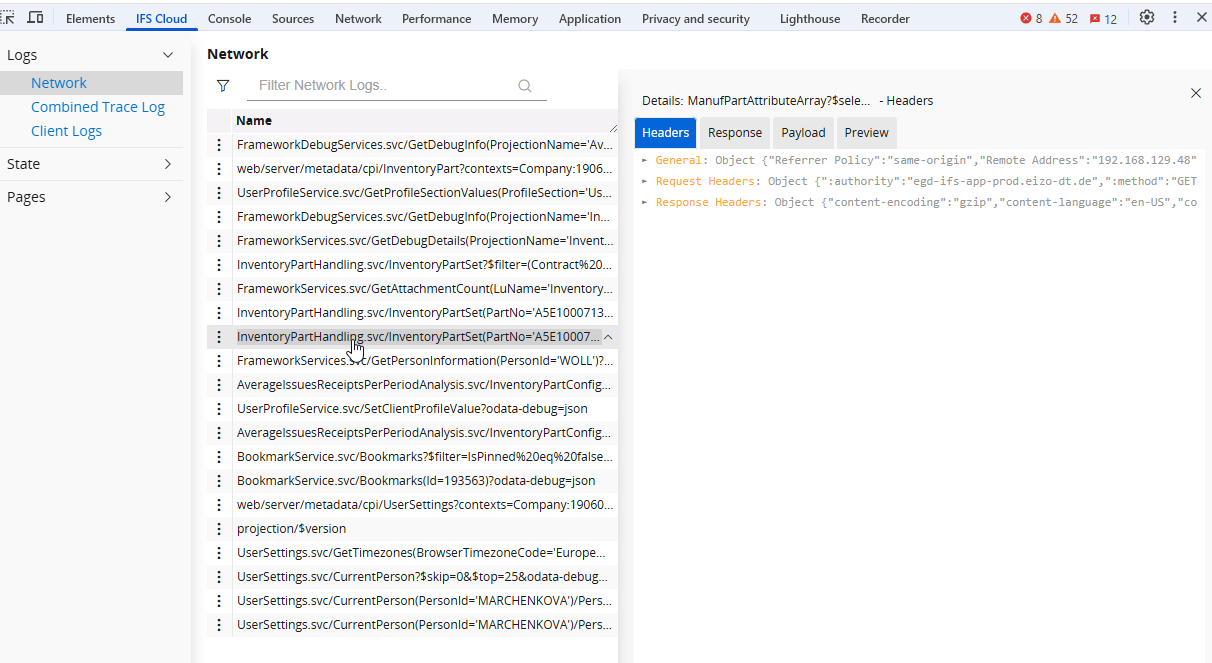
Since the IFS debug console is discontinued in 24R1 and replaced with the IFS Cloud Web DevTools browser extension we (our company) is interested to know some more details about the “product” IFS Cloud Web DevTools browser extension since we know need to “open up” the Developer Tools function in the browser, which is locked for our ordinary users, to be able to view debug information.
For example: 

  • Are there any whitepaper/documents about the product?
  • How often is the IFS Cloud DevTools extension updated with security patches?
  • Will it be certified against the latest versions of Edge Browser

6 replies

AveTonitM
Sidekick (Partner)
Forum|alt.badge.img+9
  • Sidekick (Partner)
  • 138 replies
  • August 28, 2024

IFS debug console had also a SQL-tab that was frequently used by admins to troubleshoot e.g. when some LOV-list was empty, and the user could identify the basic data requirements from IFS documentation.

This feature is missing from 24R1 and the new DevTools. Where can we find such information now? 


Forum|alt.badge.img+6
  • Sidekick (Customer)
  • 35 replies
  • November 14, 2024

Same question here. 


Technical Outlaws
Hero (Employee)
Forum|alt.badge.img+11

Using Chrome DevTools as an example, in the IFS Cloud tab under Logs/Network, select the projection call of interest and go to the Trace tab. There you will find the select statement which populates the page.


AveTonitM
Sidekick (Partner)
Forum|alt.badge.img+9
  • Sidekick (Partner)
  • 138 replies
  • November 14, 2024

@Technical Outlaws can You please show a example? How would You use the trace tab to investigate why some LOV list is empty and how to find the basic data view from IFS Cloud navigator? I expect the trace will generate a long SQL with nested queries


Technical Outlaws
Hero (Employee)
Forum|alt.badge.img+11

To get to the bottom of why a List of Value is not showing any data may require further investigation into understanding the underlying SQL behind the LOV view (restriction could be in the where clause) on the database level, which the Trace debug won’t show.

The Trace debug will get you the view that the LOV uses, in the example below for the Master Part UoM LOV the view ISO_UNIT.


Forum|alt.badge.img+1
  • Do Gooder (Customer)
  • 3 replies
  • March 26, 2025

Dear community,

do you have any idea why Trace-tab could be missing?

Somehow I have no Trace and I don’t understand why.


Reply


Cookie policy

We use cookies to enhance and personalize your experience. If you accept you agree to our full cookie policy. Learn more about our cookies.

 
Cookie settings