One of customer having initially having PROD environment (Middle Tier server) with 12 CPU and 32Gb memory and we set scale as 10. if we increase scale 20,30.. PODS not getting started, in this case when customer is using the application reporting POD getting crashed. After that we increased hardware sizing like 24 CPU and 64Gb memory, we setup scale as 100.then PODS getting started and Application is up and running without any issues and reporting pods working properly
Now, the issue is customer checked the hardware utilization of MT server and its using only maximum 24Gb memory only and less CPU usage.
Customer want justification for the above query, why the MT server not being used even 40% of allocated memory. Can someone justify?
Page 1 / 1
there may be a case where the new architecture is optimizing process management better through parallelism or a good level of threading since there are more resources to run it and in good time concurrently.
This is the way Kubernetes (k8s) work. Even if we only use 40% of the memory we need to reserve 100% of the memory we allow the containers to grow to (their memory limit). If the k8s node only have 24Gb, the pods might start and run well for some customers, but if the pods actually need all its memory on a high load scenario the k8s node will crash.
Hello everyone,
We are currently facing significant system requirements, specifically 98 GB of memory. Despite running our MT for several months, we have never exceeded 10% of this requirement, leading to substantial unnecessary costs.
Currently, we are using Cloud Remote on AWS EC2 servers. We are considering transitioning to AWS managed services, specifically:
Amazon Elastic Kubernetes Service (EKS)
Amazon RDS for Oracle
Our goal is to establish a fail-safe production environment.
Although IFS supports Kubernetes (as mentioned here), there is limited information available regarding managed Kubernetes services.
Has anyone here tried using these managed services? Any insights or experiences would be greatly appreciated.
Thank you!
IFS do not support customers that runs IFS Cloud in their own Kubernetes infrastructure - it has to be deployed with our bundled Microk8s. EKS is not an option. We have no plans on the roadmap to support it. Maybe in the future… who knows...
Subject: Request for Procedure to Fully Shutdown Kubernetes Before OS Update
Hello,
I would like to request a clear and detailed procedure for properly shutting down the entire Kubernetes infrastructure prior to performing an OS update. Currently, using the MCTL start/stop command only stops our customer namespace, but does not affect the underlying Kubernetes infrastructure provided by IFS.
I was unable to find relevant guidance in the IFS documentation.
Thank you in advance for your support.
Best regards,
My understanding is that a OS patch can be applied while Microk8s is running. After a reboot Microk8s will start including all applications within it.
If you have doubts, you can stop and start microk8s as follows:
For a proper shutdown, do we need to do the command before the microk8s stop ?
MCTL stop
  sudo microk8s stop

Patch

reboot

sudo microk8s start
MCTI start
Again - it should not be necessary, but if you for some reason doubt microk8s is not functioning as it’s designed to do, then yes, you can stop IFS Cloud middle tier as well.
The pod statuses might look a bit more clean if you do so. After a VM restart (without stopping mickok8s or pods) you might see restarts on the pods that one might interpreted as error, but it is not - it is just the normal way k8s shows state after a k8s restart.
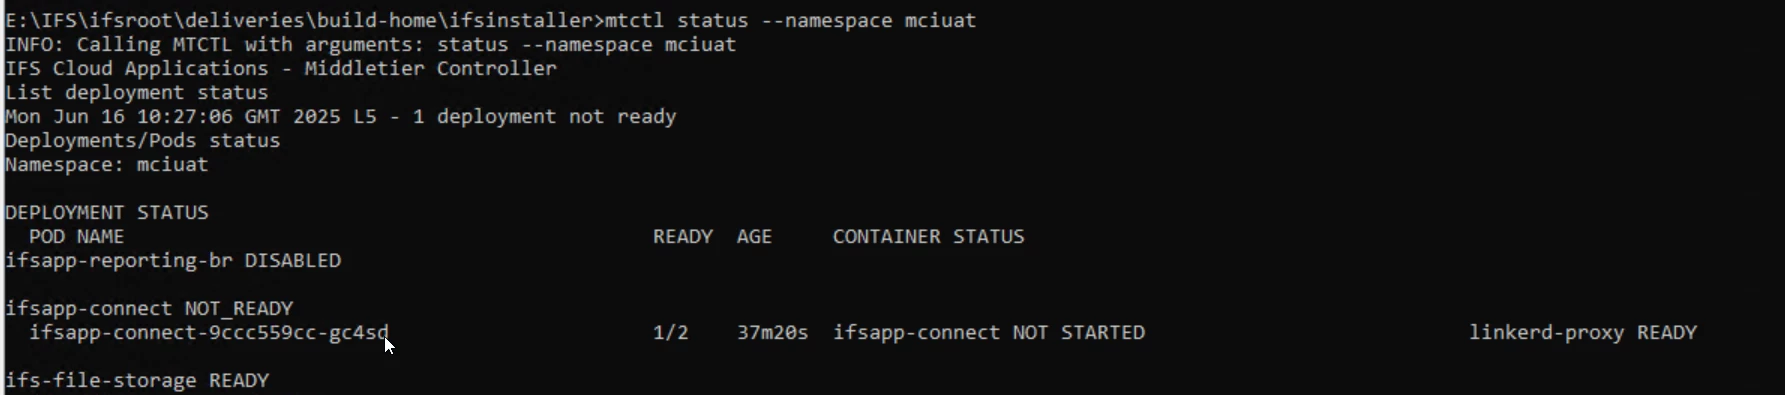
I just did a mctl stop and start, but I still have an issue with one pod/ ifsapp-connect NOT STARTED, ½ how can I solve this ?
Best Regards
We are experiencing the same issues. We have been running MT with 10 cores and 48 Gb RAM for one year without any issues.
After rebooting the MT to apply patches some PODS does not go online, specifically the reporting PODS. We will increase cores to 16 and test later today.
But the underlying problem is as described, the PODS require a lot of CPU/RAM but the actual utilization is appalling.
We are running Replicas: 3 and Scale: 100
e are experiencing the same issues. We have been running MT with 10 cores and 48 Gb RAM for one year without any issues.
After rebooting the MT to apply patches some PODS does not go online, specifically the reporting PODS. We will increase cores to 16 and test later today.
But the underlying problem is as described, the PODS require a lot of CPU/RAM but the actual utilization is appalling.
We are running Replicas: 3 and Scale: 100
In our case: there are no users connected, the requirements are met and it worked before the reboot.
CPU(s): 16 cores and 96 GB of ram
Status “NOT STARTED” is strange… i thought i seen them all :)
To see the underlying reason for that state do a “kubectl describe pod <connect-pod>” - last elines will show the event of the pod. This has to be done immediately after you get a state of interest - k8s events are only kept for a short time. The event can also reside on the deployment “kubectl describe deploy ifsapp-connect” or seldom also on the replica set “kubectl describe rs <connect rs>”
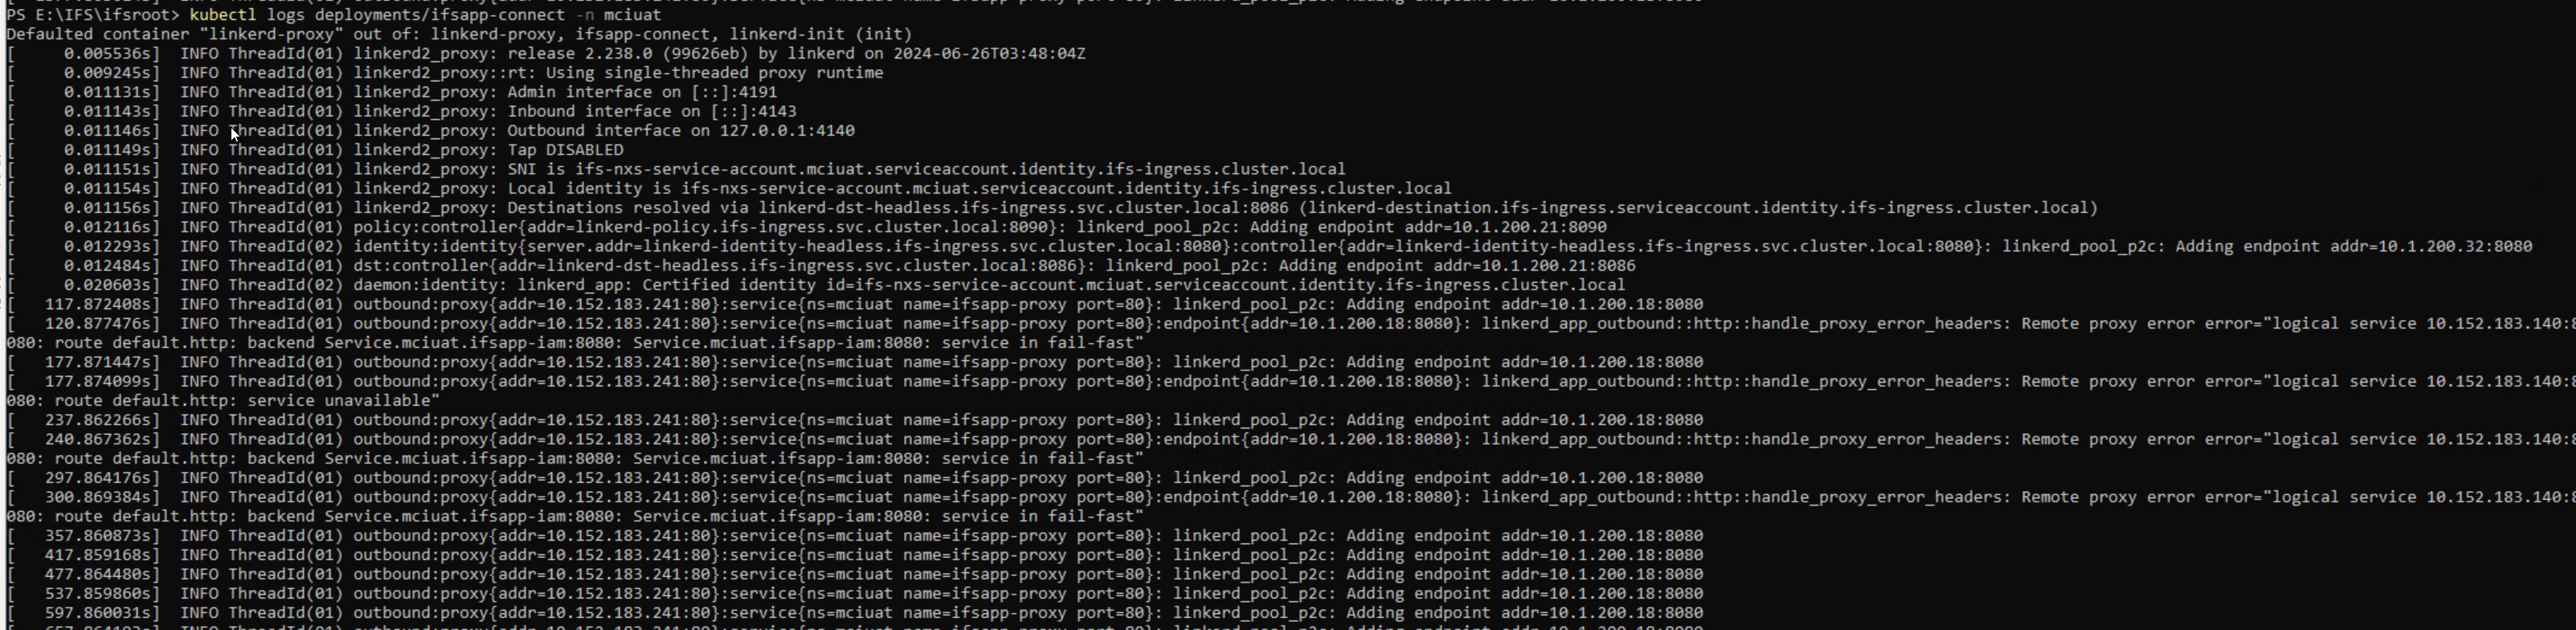
The log you pasted is from the linkerd-proxy container in the ifsapp-connect pod… you need to specify the ifsapp-connect container to get the desired log: “kubectl logs <connect-pod> -c ifsapp-connect”
I agree, kubernetes memory management i “appalling” To not get OOM on individual nodes when some pods peak on a node we need to reserve peak memory for each pod, even if only part of their memory is used when the pods idle.
e are experiencing the same issues. We have been running MT with 10 cores and 48 Gb RAM for one year without any issues.
After rebooting the MT to apply patches some PODS does not go online, specifically the reporting PODS. We will increase cores to 16 and test later today.
But the underlying problem is as described, the PODS require a lot of CPU/RAM but the actual utilization is appalling.
We are running Replicas: 3 and Scale: 100
In our case: there are no users connected, the requirements are met and it worked before the reboot.
CPU(s): 16 cores and 96 GB of ram
You might have different issues than us. But we have deactivated certain pods that we do not use, to improve performance.
For example in our ifscloud-values.yaml (we have deactivated a dozen pods):
ifsappextensibility:
  replicas: 0

ifsappscim:
  replicas: 0

ifsvirusscanner:
  replicas: 0

ifsappsigningservice:
  replicas: 0

ifsapprmpanel:
  replicas: 0

ifsappnativeexecutor:
  replicas: 0

ifsappnativenotification:
  replicas: 0

ifsappnativeserver:
  replicas: 0

ifsappreportingwebdesigner:
  replicas: 0

ifsappreportingwebdesignerren:
  replicas: 0

ifsappreportingwebruntimeren:
  replicas: 0

ifsappreportingwebtransformer:
  replicas: 0

ifsapppowerbisvc:
  replicas: 0

ifsappbusmod:
  replicas: 0

ifsappdoc:
  replicas: 1
We reconfigured the MT servers with 16 cores and kept 48Gb RAM, after restarting the machines all the PODS started, also a bit quicker than usual.
Just made a script that can be used in an runtime env to see the used, allocated and available memory. - if it don’t work or you have questions on it - use ChatGPT
# Extract memory limits and sum them while read -r mem; do #echo "$mem" if >� $mem == *Mi ]]; then val=${mem%Mi} ((total_mib += val)) elif l) $mem == *M ]]; then val=${mem%M} ((total_mib += val)) fi done < <(grep -A3 'Limits:' ./descpods.txt | grep 'memory' | awk '{print $2}')
echo "Total Allocated Memory: $total_mib"
total_mib=0
kubectl top pods --no-headers > ./toppods.txt
while read -r mem; do #echo "$mem" if /> $mem == *Mi ]]; then val=${mem%Mi} ((total_mib += val)) elif � $mem == *M ]]; then val=${mem%M} ((total_mib += val)) fi done < <(cat ./toppods.txt | awk '{print $3}')
echo "Total Used Memory: $total_mib"
kubectl describe node | grep -A6 Capacity
rm ./descpods.txt ./toppods.txt
Hello,
Thanks for the feedback.
The mayor issue remains: why do we need to provide HUGE memory on MT Linux Server, it has a very high cost. Even for non production server.
We tried to strip down the required memory for 96 GB to 48 GB and the pods simply did not start.
Regarding the memory use:
Memory usage per pod in namespace 'mcicfg':
------------------------------------------------
ifs-file-storage-8f4f455b9-whnfg : 152 Mi
ifs-virus-scanner-78fb69cb6b-r9x99 : 1482 Mi
ifsapp-am-workqueue-89b5b684b-6sjm8 : 13 Mi
ifsapp-amm-5958f8b94f-67srb : 323 Mi
ifsapp-application-svc-75d6dcc866-svpss : 300 Mi
ifsapp-client-5d799fdf4d-chjkt : 10 Mi
ifsapp-client-notification-56d665d96f-ldpsw : 177 Mi
ifsapp-client-services-66fbbdc698-xt7ws : 582 Mi
ifsapp-connect-5fd8dd6d9d-jmrcb : 1355 Mi
ifsapp-doc-58f69f56f9-df6rg : 1120 Mi
ifsapp-docman-esign-7d46d6557b-28k5g : 149 Mi
ifsapp-extensibility-6d7456464d-k6vht : 85 Mi
ifsapp-iam-5f7b9cf6d9-lctk9 : 674 Mi
ifsapp-native-executor-7b985b8587-mxlhv : 196 Mi
ifsapp-native-notification-9dc7c6755-smj56 : 186 Mi
ifsapp-native-server-685d6fd57-78gbq : 717 Mi
ifsapp-odata-665c9c4666-pfzwg : 1197 Mi
ifsapp-proxy-dcd55db84-ds9xs : 21 Mi
ifsapp-reporting-5dc5b4c46-fsc4x : 488 Mi
ifsapp-reporting-br-65857d7469-x82qm : 103 Mi
ifsapp-reporting-ren-7f954d69dd-wblfq : 382 Mi
ifsapp-reporting-web-designer-6d5c95d4d9-hppx8 : 5 Mi
ifsapp-reporting-web-designer-ren-bdcd44c58-q929z : 85 Mi
ifsapp-rmpanel-bfc469479-4lfgj : 97 Mi
ifsapp-rmsync-764c597488-gfzp9 : 133 Mi
ifsapp-scim-6bcc5d8bc4-2tfdt : 120 Mi
ifsapp-signing-service-55f76477f7-gvb7b : 147 Mi
------------------------------------------------
Total memory used: 10299 Mi
PS E:\ifsroot>
As you can see it is barely 10 GB of memory used !! This is insane to have a server with 96GB. Where is it HARDCODED ?
You need to consider the specifications of the infrastructure you're using. For example, we're currently running our middleware VM on Azure using a Standard D8as v4 instance. We’ve stopped unused pods to optimize performance, and we're running IFS Cloud 24R with 2 replicas for OData pods, which works well for our setup.
Additionally, If you increase the scale value you’ll need to ensure that your VM has sufficient memory (more scale means more memory).
Is there some documentation of the purpose of each pod so we can decide whether the pod needs to be started or not
Thanks for the link, but when looking at the linux journal, pods are just crahsing radomly when out of memory and if you are lucky and have loads of mémory, then you are event not aware about it.
So logon on you MT with the ifs credentials
journalctl --since "2025-08-07 11:20"

And then you can find for a pod like "ifsapp-doc"


Aug 07 11:20:33 MCIHPDIFSL02.d29.tes.local kernel: GC Thread#0 invoked oom-killer: gfp_mask=0xcc0(GFP_KERNEL), order=0, oom_score_>
Aug 07 11:20:33 MCIHPDIFSL02.d29.tes.local kernel: CPU: 14 UID: 8983 PID: 3002637 Comm: GC Thread#0 Not tainted 6.14.0-1010-aws #1>
Aug 07 11:20:33 MCIHPDIFSL02.d29.tes.local kernel: Hardware name: Amazon EC2 r5.4xlarge/, BIOS 1.0 10/16/2017
Aug 07 11:20:33 MCIHPDIFSL02.d29.tes.local kernel: Call Trace:
Aug 07 11:20:33 MCIHPDIFSL02.d29.tes.local kernel:  <TASK>
Aug 07 11:20:33 MCIHPDIFSL02.d29.tes.local kernel:  dump_stack_lvl+0x76/0xa0
Aug 07 11:20:33 MCIHPDIFSL02.d29.tes.local kernel:  dump_stack+0x10/0x20
Aug 07 11:20:33 MCIHPDIFSL02.d29.tes.local kernel:  dump_header+0x48/0x220
Aug 07 11:20:33 MCIHPDIFSL02.d29.tes.local kernel:  oom_kill_process+0x116/0x270
Aug 07 11:20:33 MCIHPDIFSL02.d29.tes.local kernel:  out_of_memory+0x102/0x330
Aug 07 11:20:33 MCIHPDIFSL02.d29.tes.local kernel:  mem_cgroup_out_of_memory+0x13b/0x170
Aug 07 11:20:33 MCIHPDIFSL02.d29.tes.local kernel:  try_charge_memcg+0x40a/0x5a0
Aug 07 11:20:33 MCIHPDIFSL02.d29.tes.local kernel:  charge_memcg+0x34/0x70
Aug 07 11:20:33 MCIHPDIFSL02.d29.tes.local kernel:  __mem_cgroup_charge+0x31/0xa0
Aug 07 11:20:33 MCIHPDIFSL02.d29.tes.local kernel:  alloc_anon_folio+0x1cd/0x450
Aug 07 11:20:33 MCIHPDIFSL02.d29.tes.local kernel:  do_anonymous_page+0x16b/0x440
Aug 07 11:20:33 MCIHPDIFSL02.d29.tes.local kernel:  handle_pte_fault+0x1ce/0x1f0
Aug 07 11:20:33 MCIHPDIFSL02.d29.tes.local kernel:  __handle_mm_fault+0x62c/0x770
Aug 07 11:20:33 MCIHPDIFSL02.d29.tes.local kernel:  handle_mm_fault+0x106/0x2b0
Aug 07 11:20:33 MCIHPDIFSL02.d29.tes.local kernel:  do_user_addr_fault+0x1be/0x840
Aug 07 11:20:33 MCIHPDIFSL02.d29.tes.local kernel:  exc_page_fault+0x85/0x1a0
Aug 07 11:20:33 MCIHPDIFSL02.d29.tes.local kernel:  asm_exc_page_fault+0x27/0x30
Aug 07 11:20:33 MCIHPDIFSL02.d29.tes.local kernel: RIP: 0033:0x72d894713050
Aug 07 11:20:33 MCIHPDIFSL02.d29.tes.local kernel: Code: 4c 89 ff e8 82 95 f6 ff eb 97 48 39 f7 73 17 48 83 fa 01 75 15 0f 1f 44 0>
Aug 07 11:20:33 MCIHPDIFSL02.d29.tes.local kernel: RSP: 002b:000072d88162d7b8 EFLAGS: 00010206
Aug 07 11:20:33 MCIHPDIFSL02.d29.tes.local kernel: RAX: 000072d894d5d7e8 RBX: 000072d893ad9288 RCX: 0000000000000001
Aug 07 11:20:33 MCIHPDIFSL02.d29.tes.local kernel: RDX: 0000000000001000 RSI: 00000000fe800000 RDI: 00000000e0291000
Aug 07 11:20:33 MCIHPDIFSL02.d29.tes.local kernel: RBP: 000072d88162d7e0 R08: 0000000000000000 R09: 0000000000000000
Aug 07 11:20:33 MCIHPDIFSL02.d29.tes.local kernel: R10: 0000000000000000 R11: 0000000000000246 R12: 000072d893ad9270
Aug 07 11:20:33 MCIHPDIFSL02.d29.tes.local kernel: R13: 0000000040000000 R14: 000072d89085f800 R15: 000072d893ad9b38
Aug 07 11:20:33 MCIHPDIFSL02.d29.tes.local kernel:  </TASK>
Aug 07 11:20:33 MCIHPDIFSL02.d29.tes.local kernel: memory: usage 1562500kB, limit 1562500kB, failcnt 446
Does anyone has encountered this issue ??
This means: 1 562 500kB is someware hardcoded in the ifs core pod