We have a user that is updating Cost set 2 monthly and would like to be able to see a break of Material, Labor and OH for Cost Set 2. The inventory value report is reporting on CS1 only, and the Inventory Simulation only shows the rolled up costs for manufactured parts.
Is there any other reports we could use to get CS2 inventory value that breaks out Material, Labor and OH? We would really like to be able to run the Inventory value report using the different Cost sets.
We are running APPS 9.
Rob
Best answer by Tharindu Illangasinghe
Hi @rcanning ,
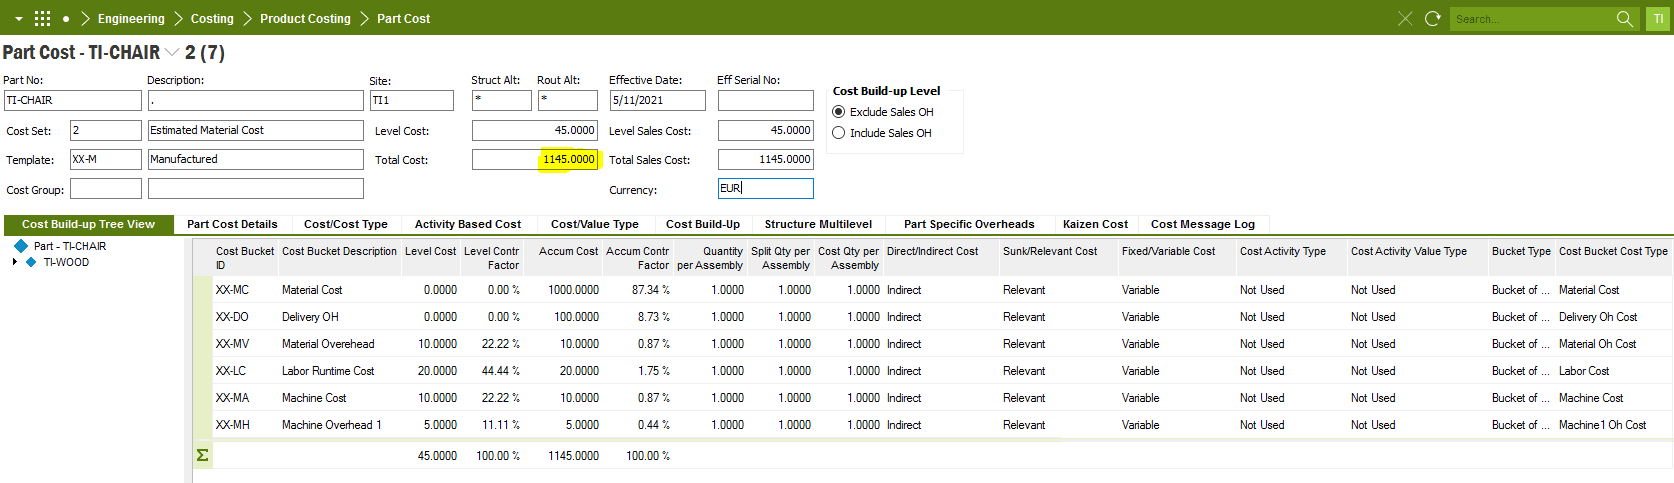
If you want to view the detail breakdown of the CS2 you can use the Part Cost window.
Search for Part No and Cost Set “2”. Highlighted value will be the Unit Cost once this CS is copied to CS1
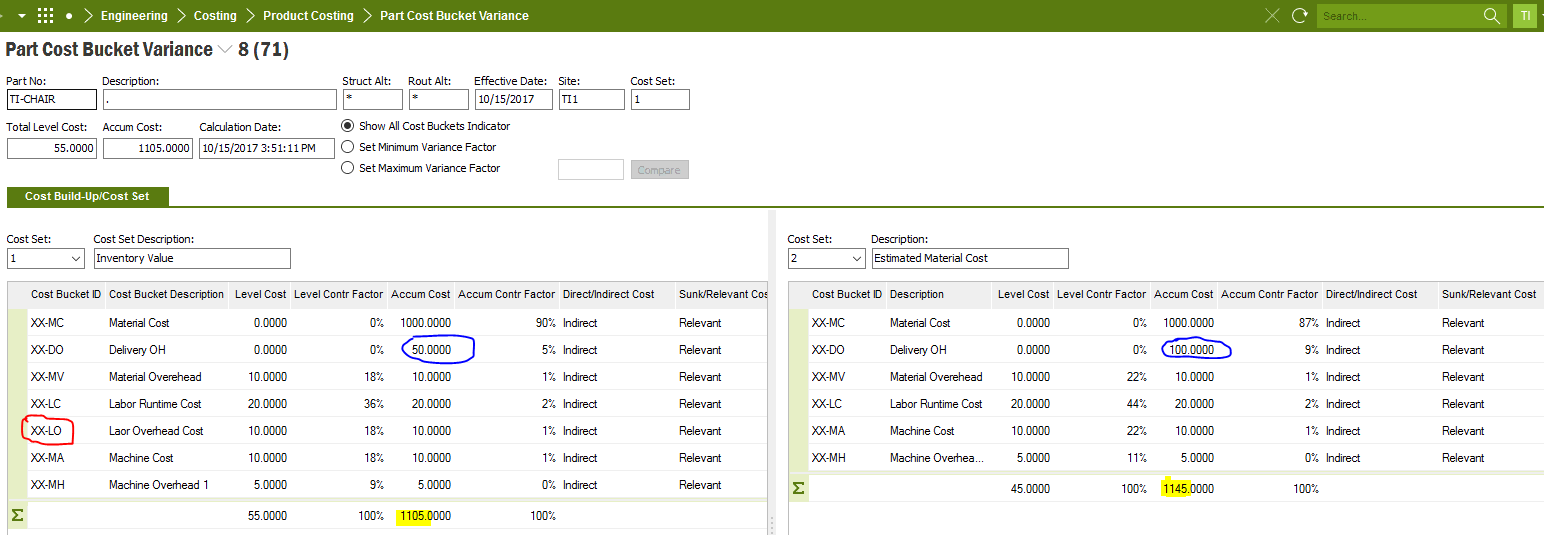
However, I believe what you are looking for is a way to compare CS1 vs. CS2. So, you can identify what costs has been changed now. For that, you can use “Part Cost Bucket Variance” window.
The yellow highlighted values can be taken as the possible Unit Cost. There you can see a difference (1105 vs 1145) between two CSs. Now, using this window user can identify how that difference has come up. Note that Labor Overhead Cost bucket is no longer there in the CS2 (highlighted in Red at CS1).Additionally, the Delivery OH too has been increased in the CS2 now (highlighted in Blue). Such changes can be observed here.
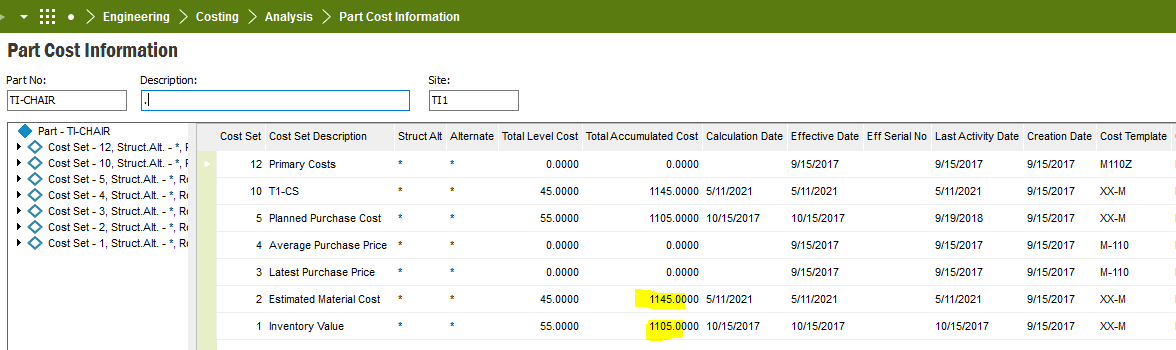
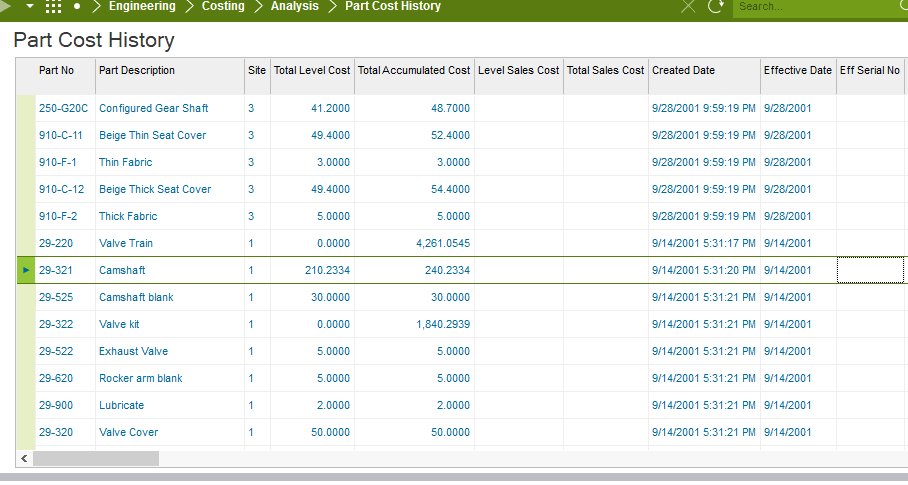
However, if you want a high-level comparison between two CSs then you can use below windows as well.
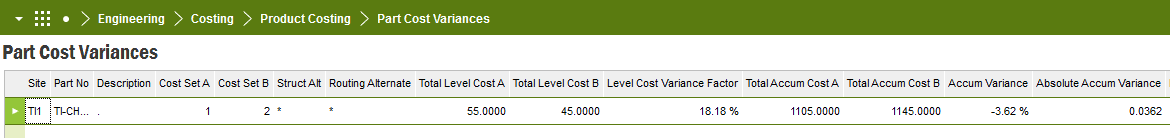
Lot more columns are there if you scroll to right hand side
Last but not least, you can use the below report as well. But you will have to get two reports, one for CS1 and another for CS2, then compare the changes manually.
Thank you for your quick response; however the Part Cost History window will not work in this case.
Our user would like to run an Inventory Simulation for Cost set 1 vs cost set 2, and be able to see the cost break out for Manufactured parts. This would tell the user what is driving the cost differential, is it material costs, is it labor costs from changing the routings. Right now they would have to look at manufactured part, that had a cost difference, to see if it is a material price increase, or if it is driven by changes to the routings which would effect labor and OH costs. We are using Standard Cost, and only updating labor and OH rates once a year.
If you want to view the detail breakdown of the CS2 you can use the Part Cost window.
Search for Part No and Cost Set “2”. Highlighted value will be the Unit Cost once this CS is copied to CS1
However, I believe what you are looking for is a way to compare CS1 vs. CS2. So, you can identify what costs has been changed now. For that, you can use “Part Cost Bucket Variance” window.
The yellow highlighted values can be taken as the possible Unit Cost. There you can see a difference (1105 vs 1145) between two CSs. Now, using this window user can identify how that difference has come up. Note that Labor Overhead Cost bucket is no longer there in the CS2 (highlighted in Red at CS1).Additionally, the Delivery OH too has been increased in the CS2 now (highlighted in Blue). Such changes can be observed here.
However, if you want a high-level comparison between two CSs then you can use below windows as well.
Lot more columns are there if you scroll to right hand side
Last but not least, you can use the below report as well. But you will have to get two reports, one for CS1 and another for CS2, then compare the changes manually.