IFS Report Designer reports support only Pie, Bar and Line charts.
If you use Crystal Reports (via the Crystal Integration) you can use Gantt charts, but the development should be done using Crystal Report Designer, and by adhering Crystal-IFS development guidelines.
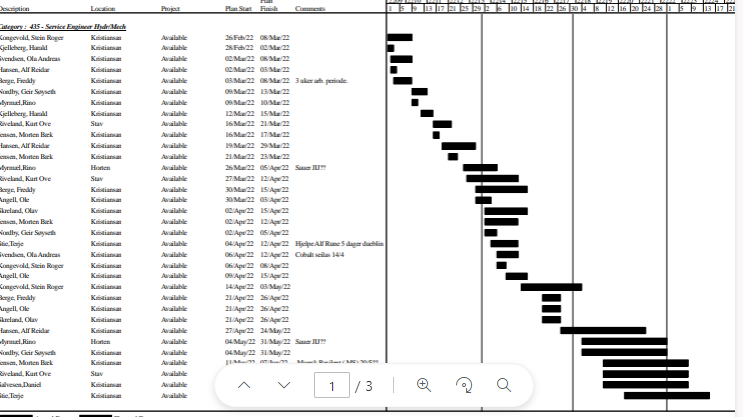
Apart from that, AURENA supports Gantt charts overviews too (if the report is not the only option).
Using IFS’s external report integration (to use MS BI reporting) and EXCEL reporting can also be used for outputting Gantt charts.
We are exploring various options suggested. For powerBI integration, we found a good infrastructure is needed like azure tools, is that correct? Any guidelines on how to set these up?
How excel integration can be done, any steps/helpguide?
Aurena supports gantt charts--what all charts can we access in IFS?--I am aware of Dispatch console, resource monitoring gantt which somewhat matches our needs but not completely. I want to see under a WO, under a task, who all are working & from what dates in gantt charts.
We use 3 different kinds of cookies. You can choose which cookies you want to accept. We need basic cookies to make this site work, therefore these are the minimum you can select. Learn more about our cookies.
")


")

")


