Hi all,
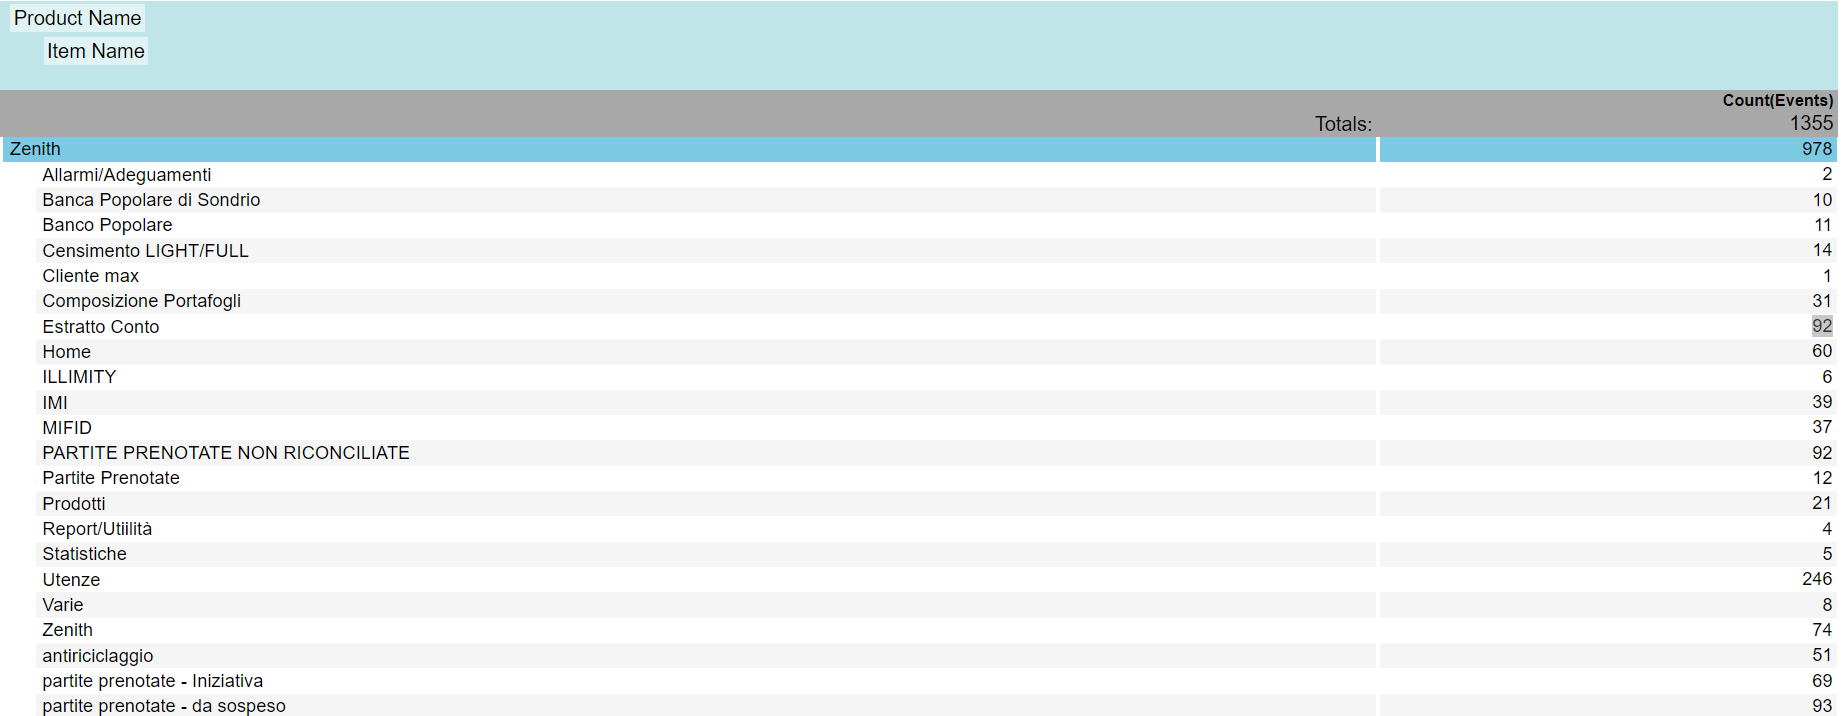
for a customer we produced the following report, which shows the most used products in the last month:
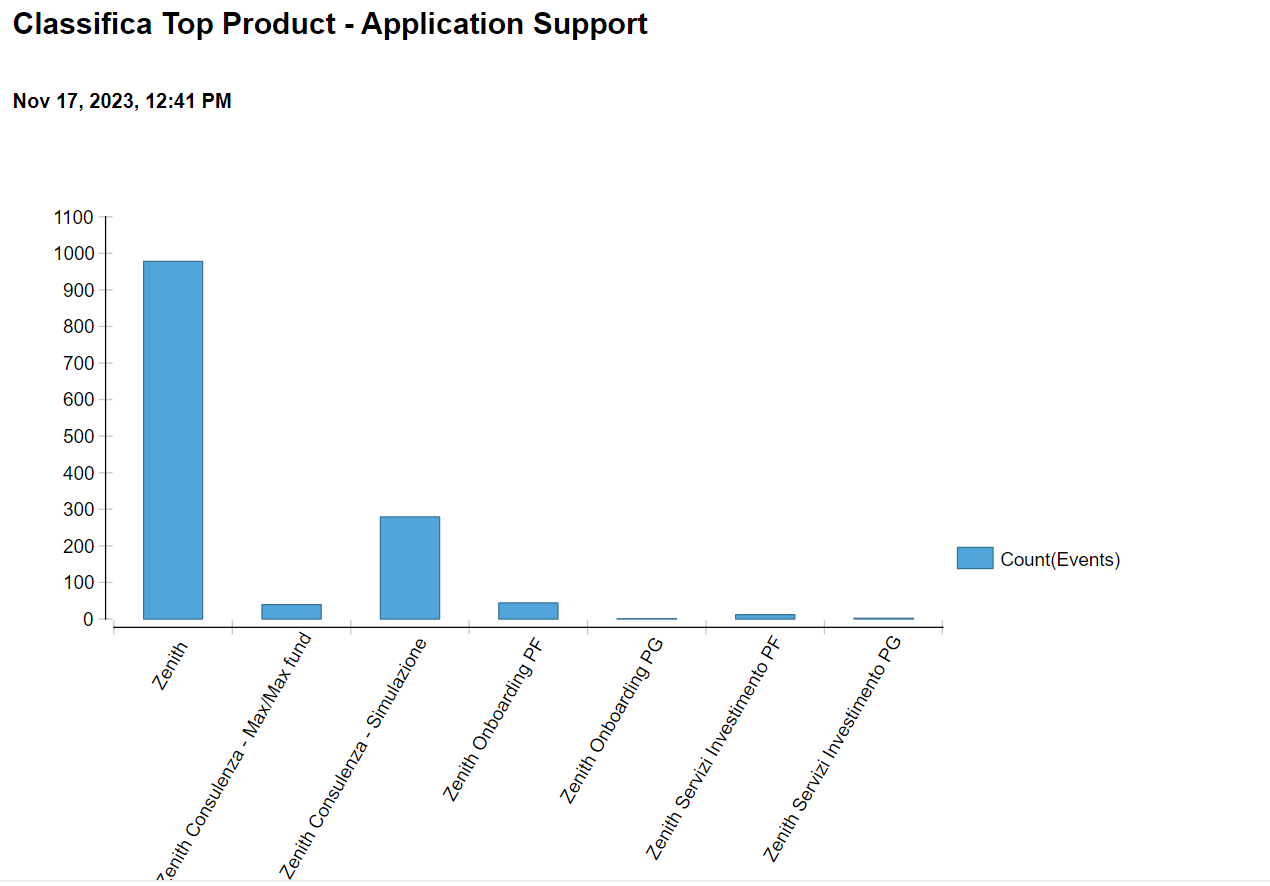
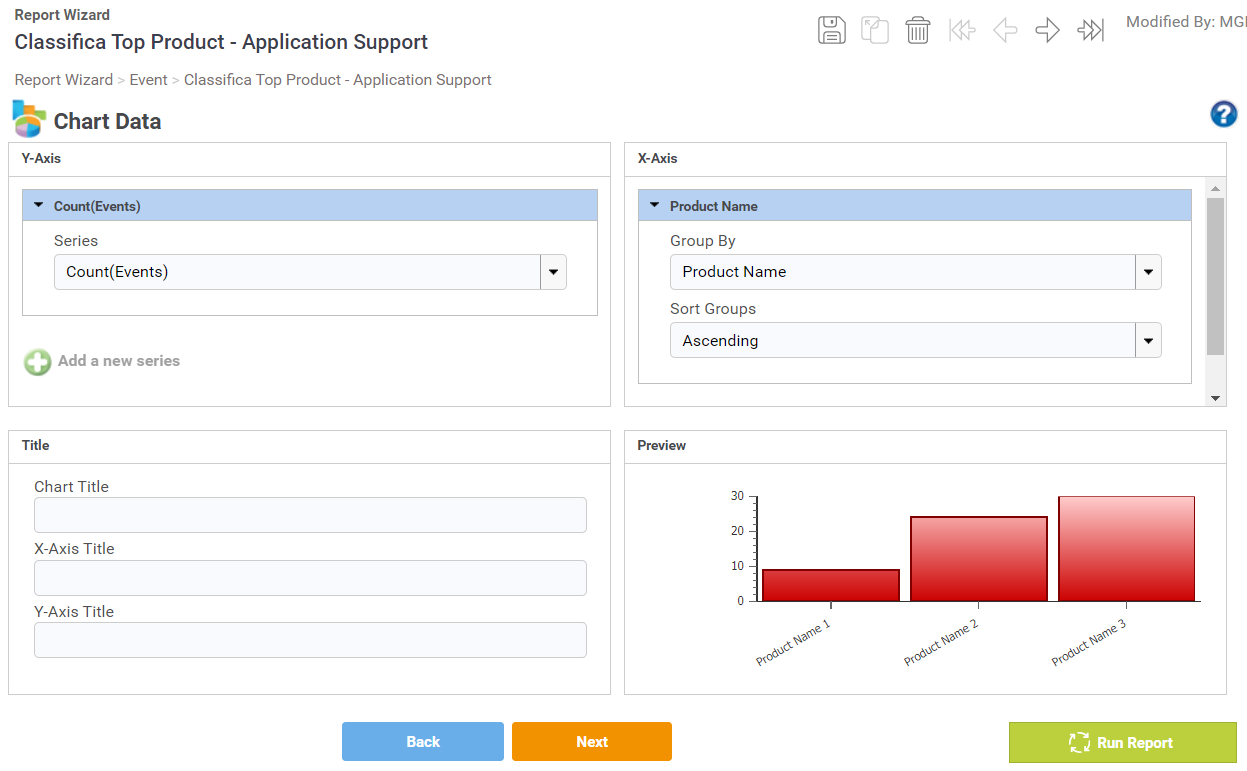
Is there a possibility to sort the graph by number of events instead of product name?
I can't find any option that allows me to do this in the Group by section of the chart data.
Furthermore, is it possible to also sort the detailed table below by count event in ascending order?