Question

Print Job stops running - Reason: Internal Server Error

  • 28 November 2023
  • 7 replies
  • 126 views

Userlevel 6
Badge +13

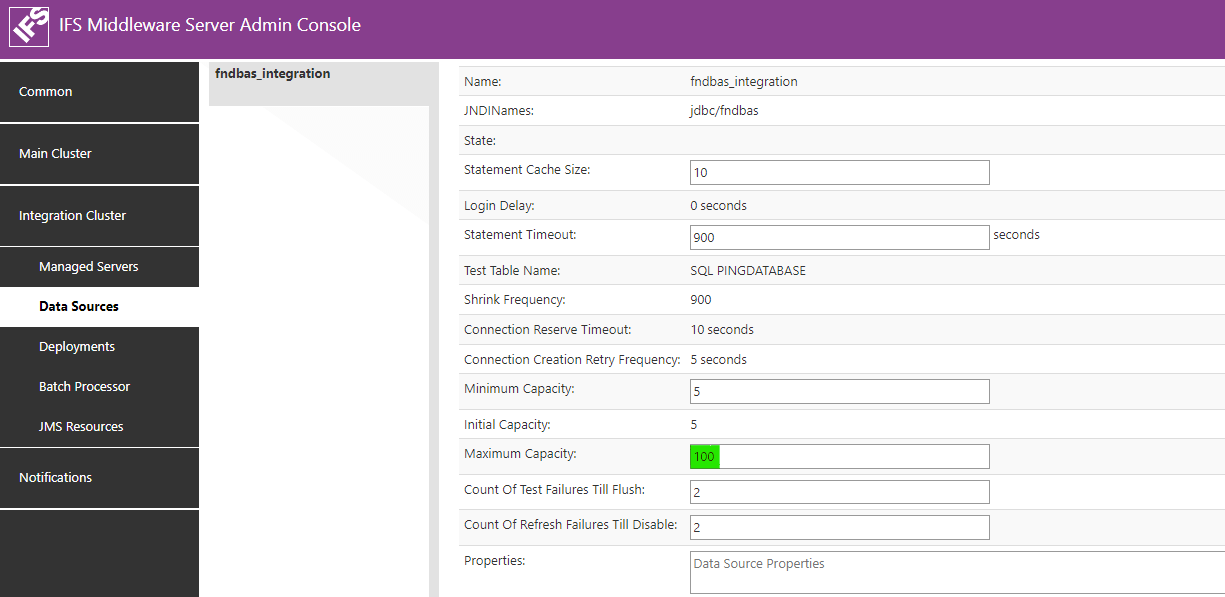
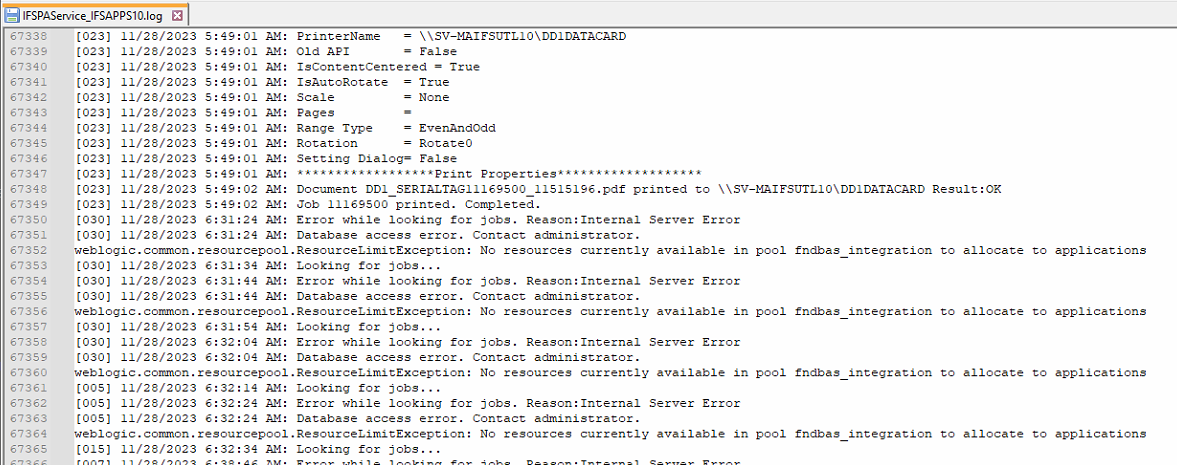
In the last few weeks we have had errors on our Print Agent. Print jobs error and we have to reboot the server to resolve the issues. We tried just restarting the Print agent service but that did not help. We also tried restarting IIS but that did not help. We are using Crystal web services and we are currently on IFS APPS10 UPD#11.

Has anyone seen these errors before?


7 replies

Userlevel 7
Badge +31

Hi @arebbeadle,

According to this, the problem is in the Integration Server side. Apparently the fndbas_integration data source has run out, so the Print Agent cannot obtain a database connection to look for new print jobs. When you restart the server, the data source gets flushed and re-initialized, which is why the error gets resolved temporarily. 

We can increase the number of connections for the fndbas_integration data source, but before that, it would be best to determine whether the data source is being exhausted due to some issue. Please check Integration Server log files to see if you can find anything. You may attach the logs from the relevant timestamp here as well. 


Increasing the fndbas_integration data source can be done from the IFS MWS Admin Console as shown below.

Hope this helps!

Userlevel 6
Badge +13

@Charith Epitawatta , where are the log files located? Is there a specific file path?


Thank you,

Userlevel 7
Badge +31

Hi @arebbeadle,

Logs files can be found in a location similar to below in your application server host:

\\<IFS_HOME>\wls_domain\<InstanceID>\servers\<ServerName>\logs

Userlevel 6
Badge +13

@Charith Epitawatta ,

Which server should I look at, IntServer1?


Userlevel 7
Badge +31

Hi @arebbeadle,

Yes, since this is related to printing, you should look at the IntServer log files. 

Userlevel 6
Badge +13

@Charith Epitawatta , Thank you for your help. Can you tell me what the difference is between the log files.What does the access.log capture, I see IP connection but why?. I also see there os an IntServer1.out and an IntServer1.log file, what do they capture? I do see an error but I don’t know if this causing issues. Can you help advise?


Thank you,


####<Nov 28, 2023, 5:58:54,786 AM EST> <Error> <WebLogicServer> <SV-MAIFSAPP10> <IntServer1> <[ACTIVE] ExecuteThread: '64' for queue: 'weblogic.kernel.Default (self-tuning)'> <<WLS Kernel>> <> <6d4ec8b2-2c31-48ed-9bb7-9a810b30617e-0007ef8f> <1701169134786> <[severity-value: 8] [rid: 0] [partition-id: 0] [partition-name: DOMAIN] > <BEA-000337> <[STUCK] ExecuteThread: '10' for queue: 'weblogic.kernel.Default (self-tuning)' has been busy for "641" seconds working on the request "Workmanager: ConnectSenderWorkManager, Version: 0, Scheduled=true, Started=true, Started time: 641671 ms
", which is more than the configured time (StuckThreadMaxTime) of "600" seconds in "server-failure-trigger". Stack trace:


Userlevel 7
Badge +31

Hi @arebbeadle,

  • Access logs keep a log of all HTTP requests that come to the server. Usually the IP addresses you see would belong to the HTTP server in IFS Middleware Server since most requests come through the HTTP server. 
  • Log files that look like <ServerName>.log are the log files which will print all logs related to the Weblogic server, on which the IFS Middleware Server is based on and application related errors as well.
  • The file with the .out extension is the standard output file which prints all logs related to the applications deployed in that particular server.

So in this case, you should be looking at the .out and .log files. 


####<Nov 28, 2023, 5:58:54,786 AM EST> <Error> <WebLogicServer> <SV-MAIFSAPP10> <IntServer1> <[ACTIVE] ExecuteThread: '64' for queue: 'weblogic.kernel.Default (self-tuning)'> <<WLS Kernel>> <> <6d4ec8b2-2c31-48ed-9bb7-9a810b30617e-0007ef8f> <1701169134786> <[severity-value: 8] [rid: 0] [partition-id: 0] [partition-name: DOMAIN] > <BEA-000337> <[STUCK] ExecuteThread: '10' for queue: 'weblogic.kernel.Default (self-tuning)' has been busy for "641" seconds working on the request "Workmanager: ConnectSenderWorkManager, Version: 0, Scheduled=true, Started=true, Started time: 641671 ms
", which is more than the configured time (StuckThreadMaxTime) of "600" seconds in "server-failure-trigger". Stack trace:


This error you see is a STUCK thread in Weblogic. A thread gets marked as STUCK if it keeps executing for more than 600 seconds, by default. This is not necessarily a problem unless you see a large number of them continuously. To determine this for certain, you would need to take a Thread Dump and analyze it. 

I think it would be a good idea to open a case with IFS and report this printing issue so that someone can have a look and see what’s going on. 


Reply