Question

IFS10 - CPU 100% and very slow system

  • 11 November 2019
  • 34 replies
  • 6264 views


Show first post

34 replies

Userlevel 5
Badge +7

Try this one. I removed an inner select statement that displays the SQL_TEXT of the command being run. You can find the SQL commands being run by querying the v$sql VIEW and matching the SQL_ID being returned form the query shown below.

select sess_cpu.con_id, 
sess_cpu.sid, 
NVL(sess_cpu.username, 'Oracle Process') username, 
sess_cpu.status, 
sess_cpu.logon_time, 
sess_cpu.machine, sess_cpu.program, sess_cpu.type, sess_cpu.event,
round((sysdate - sess_cpu.logon_time)*1440*60) logon_SECS, 
sess_cpu.value/100 SESS_CPU_SECS, (sess_cpu.value - call_cpu.value)/100 LAST_CPU_SECS,
round((sess_cpu.value/100)/round((sysdate - sess_cpu.logon_time)*1440*60)*100,2) Percent, 
sess_cpu.sql_id
from
(select se.con_id, se.sql_id, ss.statistic#, se.sid, se.username, se.status, se.program, se.logon_time, sn.name, ss.value,
se.machine, se.type, se.event
from v$session se, v$sesstat ss, v$statname sn
where se.sid = ss.sid
and sn.statistic# = ss.statistic#
and sn.name in ('CPU used by this session') ) sess_cpu,
(select se.con_id, ss.statistic#, se.sid, ss.value, value/100 seconds 
from v$session se, v$sesstat ss, v$statname sn
where se.sid = ss.sid
and sn.statistic# = ss.statistic#
and sn.name in ('CPU used when call started') ) call_cpu
where sess_cpu.sid = call_cpu.sid
and sess_cpu.con_id = call_cpu.con_id
and round((sysdate - sess_cpu.logon_time)*1440*60) > 0
order by percent desc;


Userlevel 4
Badge +9

As an alternative to a $2,000 utility, here is a query that will show sessions ranked by CPU usage and shows helpful information about the session so you can track down the process/user. The query displays helpful information like username, machine, program, type, event, and the sql text/command being referenced.


select sess_cpu.con_id, 
sess_cpu.sid, 
NVL(sess_cpu.username, 'Oracle Process') username, 
sess_cpu.status, 
sess_cpu.logon_time, 
sess_cpu.machine, sess_cpu.program, sess_cpu.type, sess_cpu.event,
round((sysdate - sess_cpu.logon_time)*1440*60) logon_SECS, 
sess_cpu.value/100 SESS_CPU_SECS, (sess_cpu.value - call_cpu.value)/100 LAST_CPU_SECS,
round((sess_cpu.value/100)/round((sysdate - sess_cpu.logon_time)*1440*60)*100,2) Percent, 
sess_cpu.sql_id,
(select sql_text from v$sql sql where sql.sql_id = sess_cpu.sql_id) sql_text
from
(select se.con_id, se.sql_id, ss.statistic#, se.sid, se.username, se.status, se.program, se.logon_time, sn.name, ss.value,
se.machine, se.type, se.event
from v$session se, v$sesstat ss, v$statname sn
where se.sid = ss.sid
and sn.statistic# = ss.statistic#
and sn.name in ('CPU used by this session') ) sess_cpu,
(select se.con_id, ss.statistic#, se.sid, ss.value, value/100 seconds 
from v$session se, v$sesstat ss, v$statname sn
where se.sid = ss.sid
and sn.statistic# = ss.statistic#
and sn.name in ('CPU used when call started') ) call_cpu
where sess_cpu.sid = call_cpu.sid
and sess_cpu.con_id = call_cpu.con_id
and round((sysdate - sess_cpu.logon_time)*1440*60) > 0
order by percent desc;


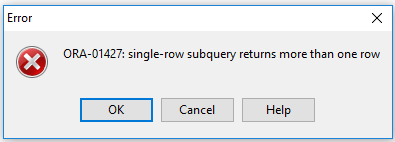
I’m getting an error running this


Userlevel 6
Badge +18

Hello,

It is interesting to note that your Apps 10 database is facing performance issues, especially CPU spiking at 100%. In our experience, Apps 10 database is designed to perform fast.

  1. Please check to see if there is any Oracle maintenance jobs running as per the Oracle alert log around the same time when the CPU spikes up. We had a client who ran into a similar issue running Oracle 12.1.0.2 and it turned out to be a maintenance job. The issue went away once the job was disabled.  
  2. Check for blocking locks in the database using the query below. This also causes high CPU usage.
  3. ------- REM IFS SQL to find blocking locks ----------------
    select logon_time, sid, serial#, blocking_session, program, seconds_in_wait, machine, client_info, username "ORACLE USERNAME", wait_class, audsid, process
    from  v$session 
    where blocking_session is not NULL 
    order by logon_time;

Please check these two first and keep me posted.

Userlevel 5
Badge +7

As an alternative to a $2,000 utility, here is a query that will show sessions ranked by CPU usage and shows helpful information about the session so you can track down the process/user. The query displays helpful information like username, machine, program, type, event, and the sql text/command being referenced.


select sess_cpu.con_id, 
sess_cpu.sid, 
NVL(sess_cpu.username, 'Oracle Process') username, 
sess_cpu.status, 
sess_cpu.logon_time, 
sess_cpu.machine, sess_cpu.program, sess_cpu.type, sess_cpu.event,
round((sysdate - sess_cpu.logon_time)*1440*60) logon_SECS, 
sess_cpu.value/100 SESS_CPU_SECS, (sess_cpu.value - call_cpu.value)/100 LAST_CPU_SECS,
round((sess_cpu.value/100)/round((sysdate - sess_cpu.logon_time)*1440*60)*100,2) Percent, 
sess_cpu.sql_id,
(select sql_text from v$sql sql where sql.sql_id = sess_cpu.sql_id) sql_text
from
(select se.con_id, se.sql_id, ss.statistic#, se.sid, se.username, se.status, se.program, se.logon_time, sn.name, ss.value,
se.machine, se.type, se.event
from v$session se, v$sesstat ss, v$statname sn
where se.sid = ss.sid
and sn.statistic# = ss.statistic#
and sn.name in ('CPU used by this session') ) sess_cpu,
(select se.con_id, ss.statistic#, se.sid, ss.value, value/100 seconds 
from v$session se, v$sesstat ss, v$statname sn
where se.sid = ss.sid
and sn.statistic# = ss.statistic#
and sn.name in ('CPU used when call started') ) call_cpu
where sess_cpu.sid = call_cpu.sid
and sess_cpu.con_id = call_cpu.con_id
and round((sysdate - sess_cpu.logon_time)*1440*60) > 0
order by percent desc;


Userlevel 7
Badge +18

Intelligent tuning is only possible with good measurements. If you’re not comfortable with STATSPACK (included with every version of Oracle) or AWR (included if you’ve separately licensed the Oracle Tuning Pack on top of Enterprise Edition), I highly recommend Database Performance Analyzer.

https://www.solarwinds.com/database-performance-analyzer

Userlevel 4
Badge +9

@alanbclark , thanks for looking at this

  1. 81.6 GB. Yes, it only serves one database
    • compatible: 12.2.0
    • cpu_count: 16
    • db_cache_size: 40G
    • job_queue_processes: 100
    • optimizer_features_enable: 11.2.0.4
    • optimizer_index_cost_adj: 10
    • pga_aggregate_target: 2000M
    • processes: 800
    • sessions: 1232
    • sga_max_size: 80G
    • sga_target: 80G
    • shared_pool_size: 4G
    • sort_area_size=65536
  2. 4 sockets / 16 vCPU
  3. Virtual
  4. Yes
  5. Yes
  6. Windows Server 2016 (1607)
  7. Yes
  8. The issue went away after the restart, and we didn’t notice any particular time consuming jobs or processes running before the restart. 
  9. Rebuild indexes are scheduled to run every 2. month. It doesn’t seems to have run after the upgrade.
  10. No
  11. Not in use
Userlevel 5
Badge +7

Pinpointing these issues may take several queries and a bit of monitoring to pin down. Can you please provide the following information.

  1. The server has 96 GB of memory installed. How much memory is being used by the “oracle.exe” process(es)? Please confirm that this server only hosts one database.
  2. What are the values of the following Oracle parameters?
    • compatible
    • cpu_count
    • db_cache_size
    • job_queue_processes
    • optimizer_deatures_enable
    • optimizer_index_cost_adj
    • pga_aggregate_target
    • processes
    • sessions
    • sga_max_size
    • sga_target
    • shared_pool_size
    • sort_area_size
  3. How many cores are assigned to this server?
  4. Is the server physical or virtual?
  5. Are the table statistics current (withing the past week)?
  6. Have the indexes been validated lately?
  7. What is the operating system version?
  8. Do you have a utility installed to view the threads under the “oracle.exe” process to see what type of process (worker, execution, job, etc) is consuming the CPU? All sessions run as a separate thread under the “oracle.exe” process.
  9. If the issue went away when the database was restarted it was either a background job (IFS or database) or an interactive process launched by a user. Please comment.
  10. What is your schedule for updating the IFS search indexes on objects? Do you have all of them enabled?
  11. When the excessive CPU was found was the database creating large numbers of archive logs? This will let us know if the process was performing any inserts, updates, or deletions as part of the processing.
  12. Do you have the in-memory option turned on?
Userlevel 4
Badge +9

@NadeeshHerath , correct. All CPU is consumed by Oracle Service. The memory usage (tot 96GB) is constantly at around 90%, I think this is normal behavior. 

We checked the background jobs when the CPU hits 100% Nothing time consuming or big things was executing, so no findings there. 


We discovered that the SWAP drive was not configured according to increased RAM, and setup as SSD. This has been fixed now, waiting to check if this has an effect. 


We have also played with the parameter OPTIMIZER_FEATURES_ENABLE, setting this to 11.2.0.4. And turned off parallel execution. Not 100% if these settings has any effect yet. Does anyone have experience with this?


We haven’t checked the Oracle Alert log, but I would assume we would’ve heard from our DB partner company if anything is wrong there.  Can check with them. I also thing we should look at the Oracle Stats pack or AWR reports. 

Userlevel 6
Badge +9

Presuming most of the CPU is being consumed by the Oracle service,

Have you checked the memory usage of the server whilst CPU hits 100%? also does CPU reach 100% only when certain batch jobs execute? (you can check this by querying the executing background jobs when CPU hits 100%). This should shed some light on the issue.


If there are no background jobs running and CPU hits 100% and there is no significant errors found in the Oracle alert log, I believe an Oracle Stats pack report or AWR report has to be analyzed in order for any issues.

Reply