WADACO Basic understanding for Debugging

  • 29 December 2022
  • 2 replies
  • 188 views

Userlevel 5
Badge +8

ISSUE/QUESTION: Unlike from usual debugging flow, there are several differences need to consider when performing WaDaCo debugging. Therefore, it is necessary to have the basic understanding when performing a wadaco related investigation.

ENVIRONMENT: Wadaco Client 
AUDIENCE: Internal, Partner

RESOLUTION/ANSWER:


High level differences are as below:

  • WaDaCo flows session always starts from Data_Capture_Session.api methods and Data_Capture_Session_Line.api methods.
  • Flow always initiates with a new session ID.
  • Basic WaDaCo method calls are as below.
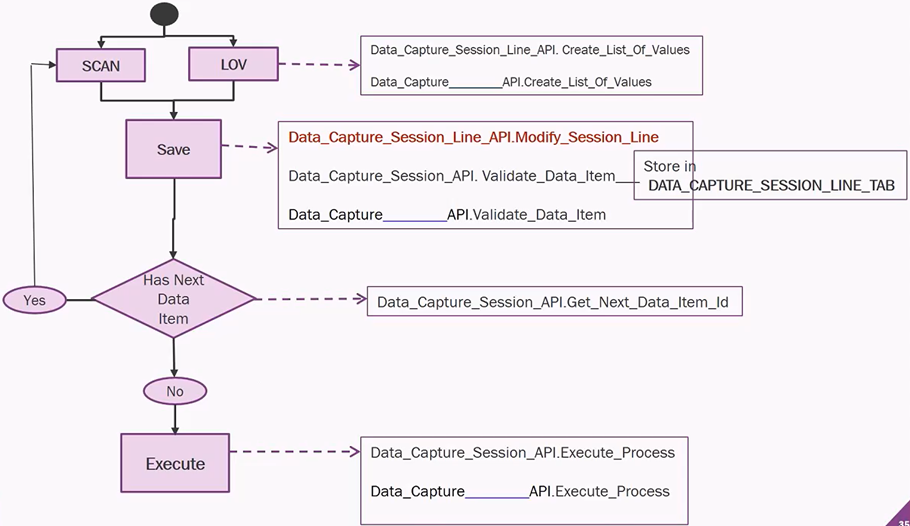
  • Depending on the functionality, corresponding product code is later called once Data_Capture_Session methods are called.
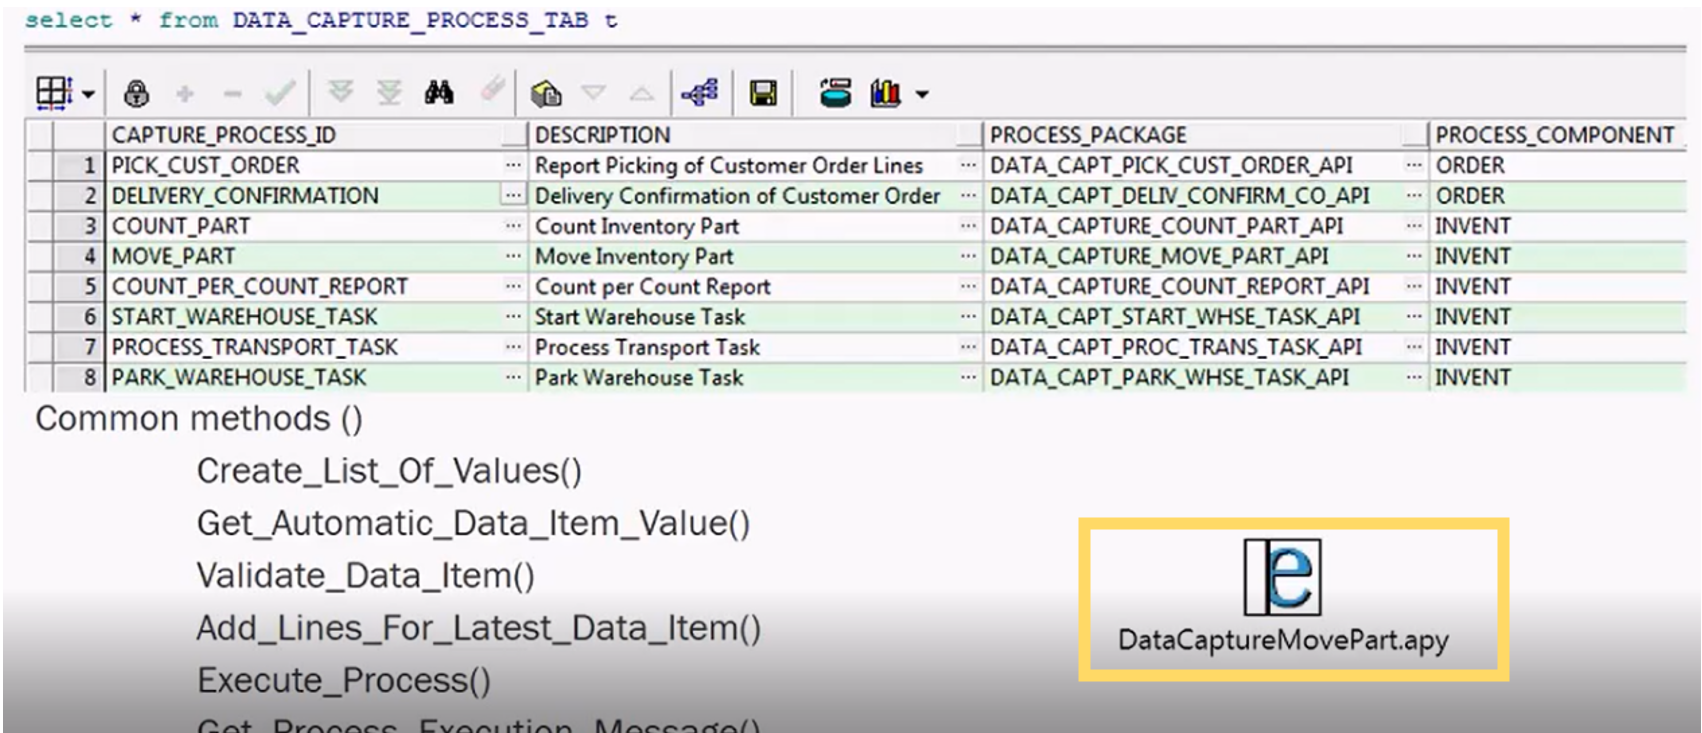
  • Every process has its own package.
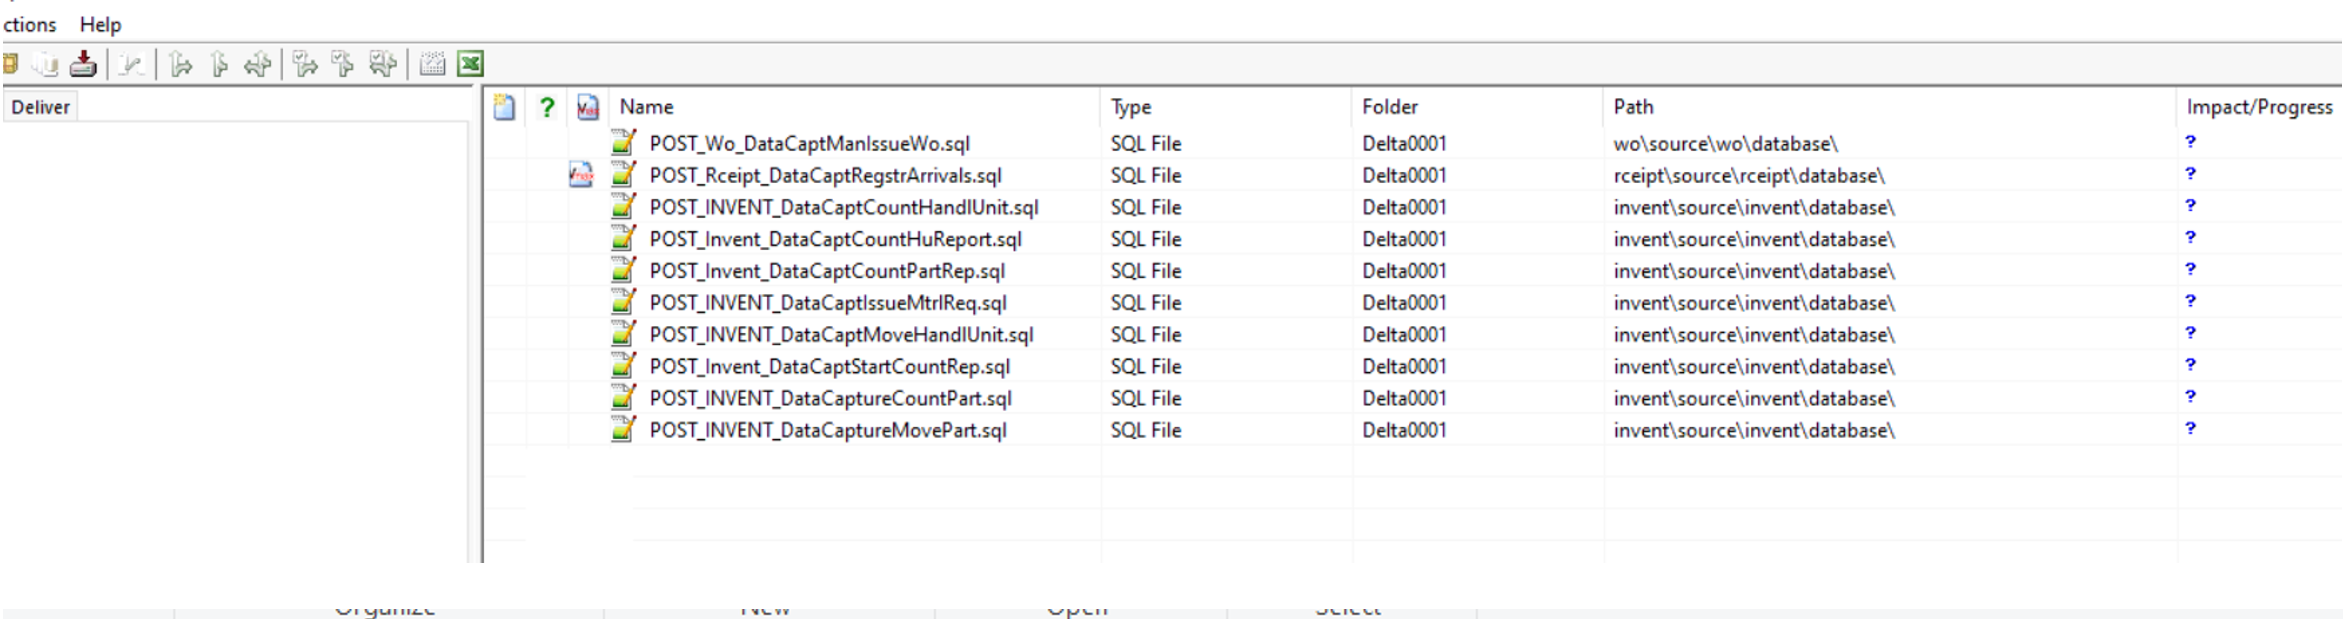
  • WaDaCo processes are included from a postscript as below. In-case if a customer is information the processes are missing, check whether below script is correctly deployed in the environments.
  • POST scripts are harvested under corresponding component. (Examples as below)
  • As per to configuration items, WaDaCo flow request data for each configuration items.
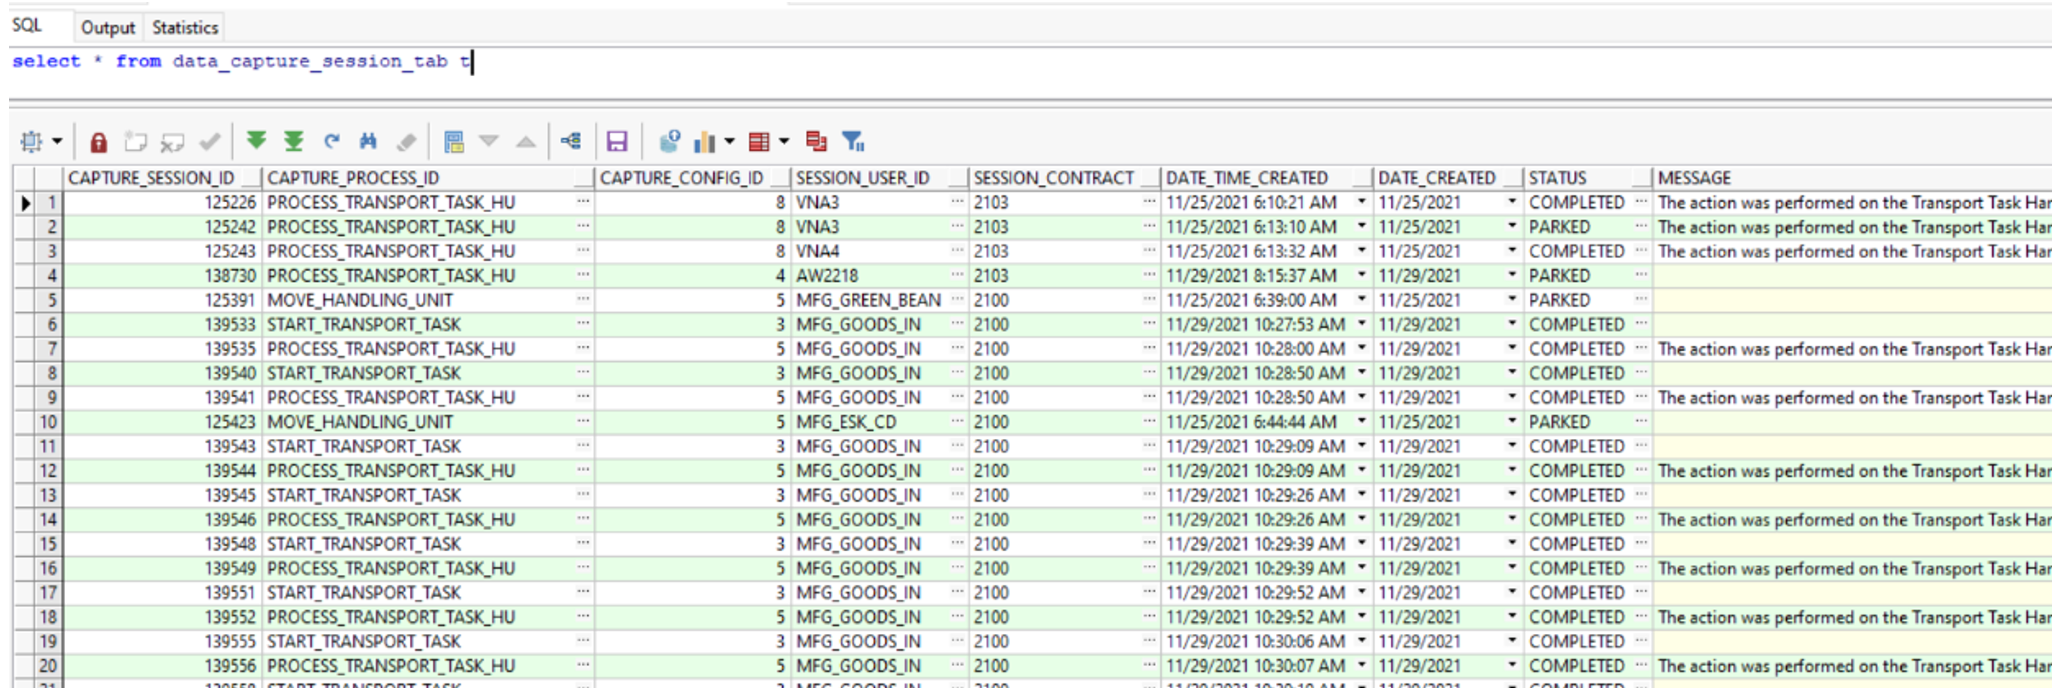
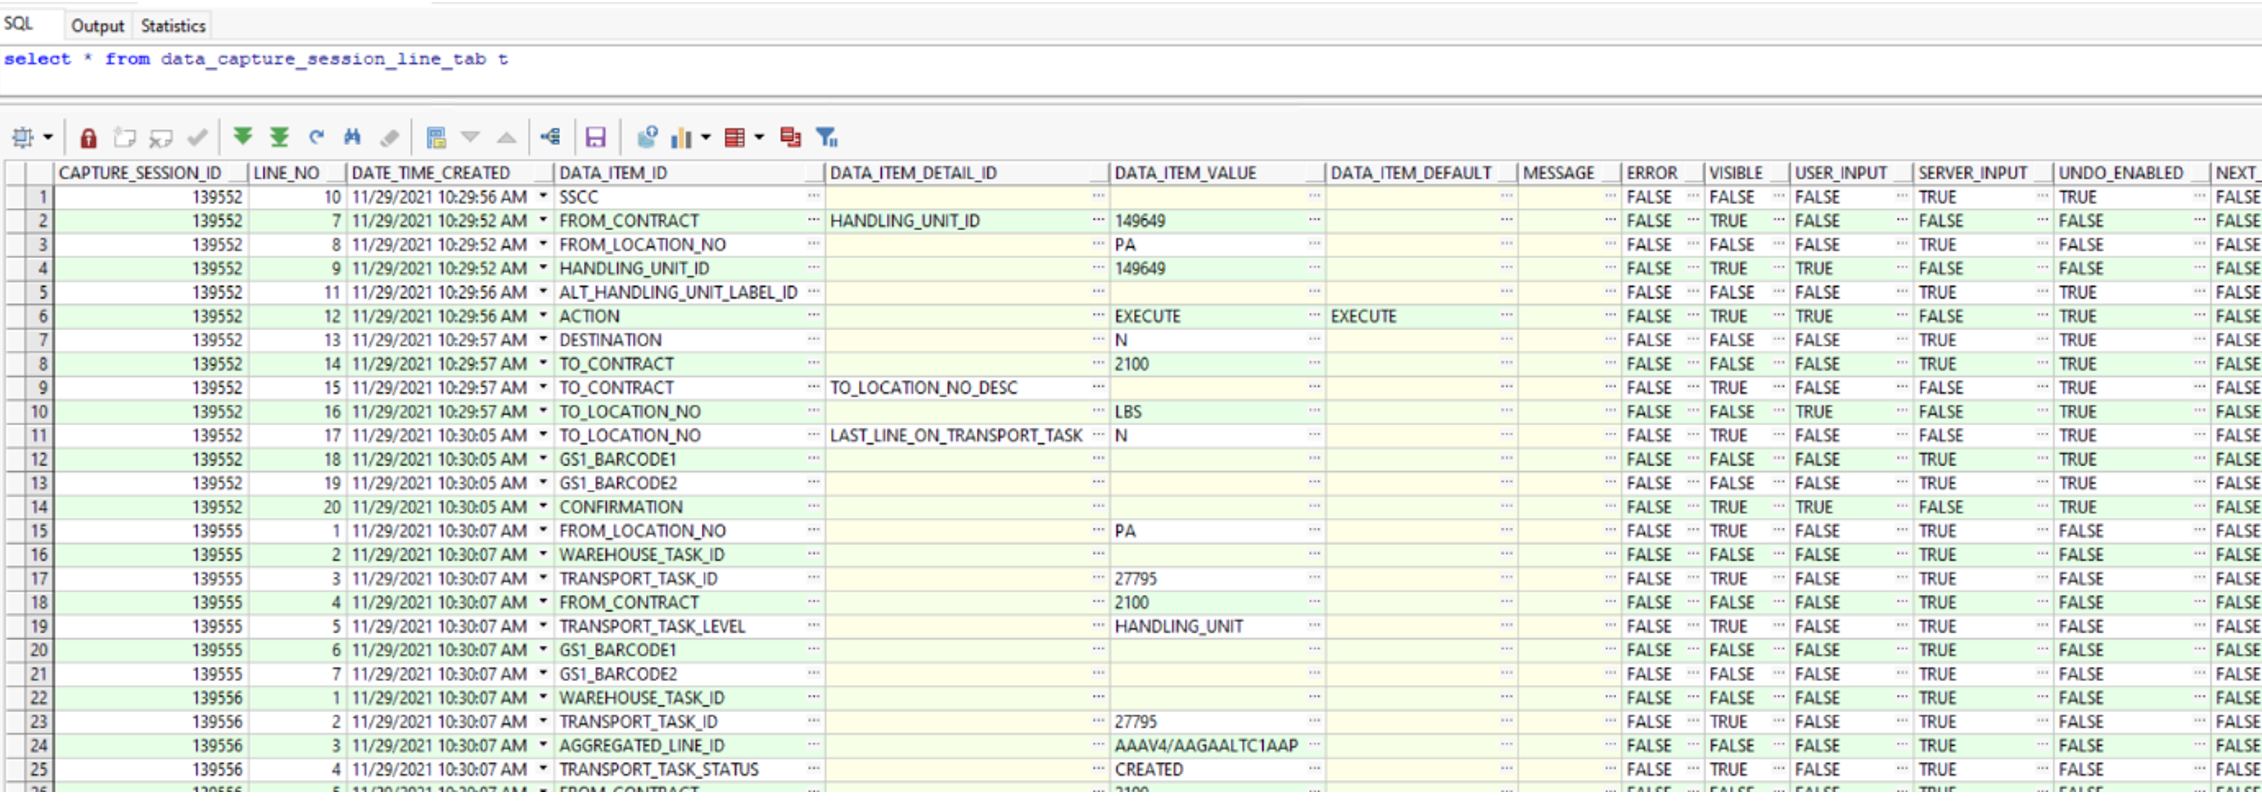
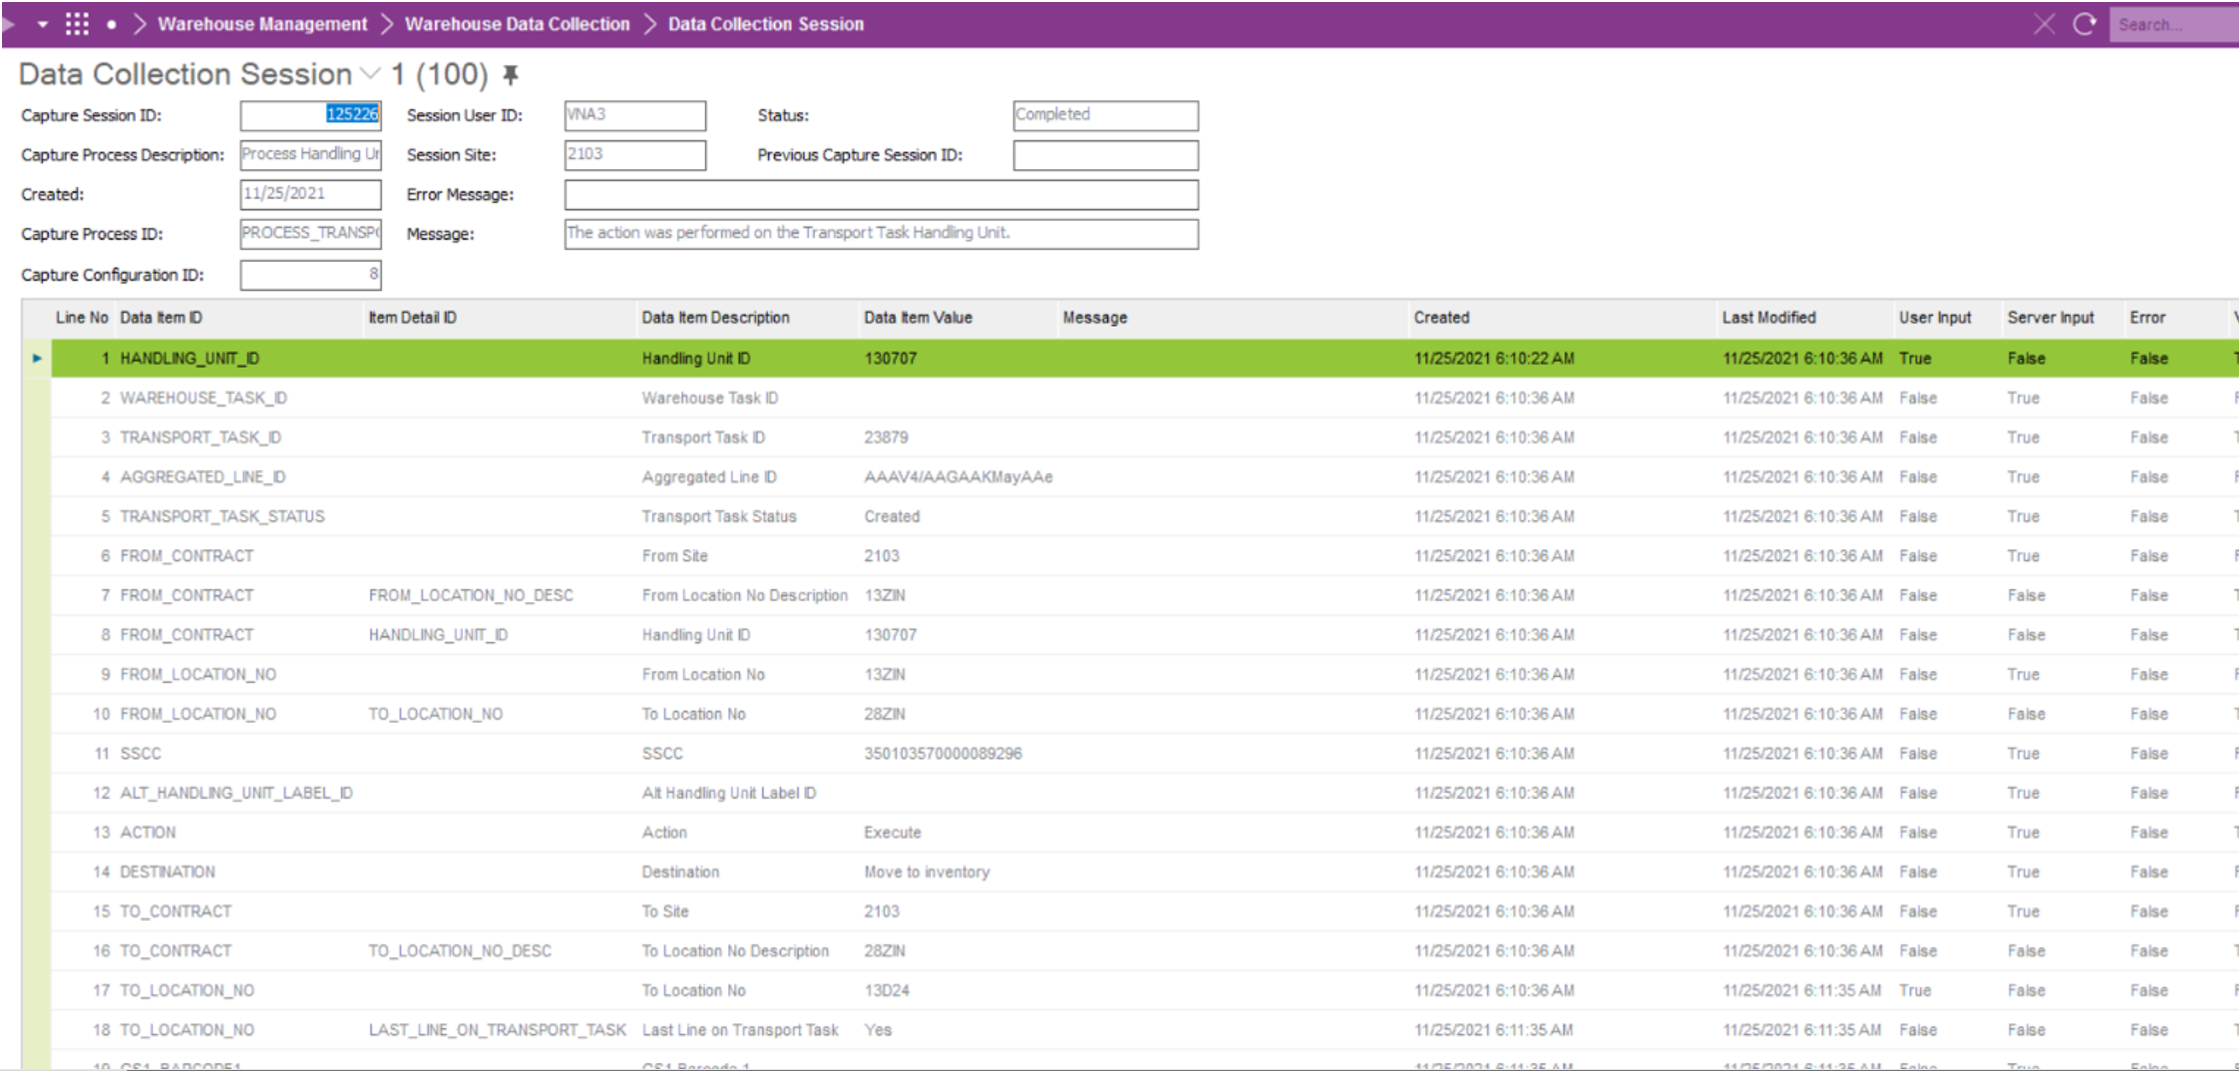
  • Relevant passed information can be viewed from Data_Capture_Session_Tab and Data_Capture_Session_Line_Tab. (Corresponding client forms are existing in client)
    • Data_Capture_Session_Tab


    • Data_Capture_Session_Line_Tab

    • Data Capture Session Client View


2 replies

Userlevel 6
Badge +16

Some addition. 

Doing traditional step by step debugging might be tricky to do for wadaco. But it is easy to add server traces to process packages or methods they use to see what is happening from a log window.
Normally its functionalities connected to either LOV, validation or use automatic value that might be good places to add server traces to find what is happening, usually adding traces in both the process package for these methods and also the methods they call for each "data source" might be logical places to add traces to help investigation a certain functionality/issue.
Sometimes issues happens during the execution phase and those can also be traced, but those can often be connected to other server logic outside the wadaco process itself so they might take some time to investigate properly, they usually starts from method Execute_Process and branch out to different server logic depending on which process it is.


For performance issues both server tracing and testing out suspicious SQL selects can be done to help investigations, but also using the Data Collection Session client can help a lot of indicating if the performance issue connected to some specific item and its settings. 
Often performance issues can be solved by changing the configuration settings or the item order for certain items in the configuration which have been found taking extra time by looking at the data collection session client.

Userlevel 4
Badge +9

@Nilushi Silva thank you very much for this write up! Helped me a lot in debugging a WADACO issue! 

keep writing this debugging information!

Reply