Hi all
In the Shop orders operation menu, I have my selection of production orders for which I want to see the overall load.
I select production orders by department
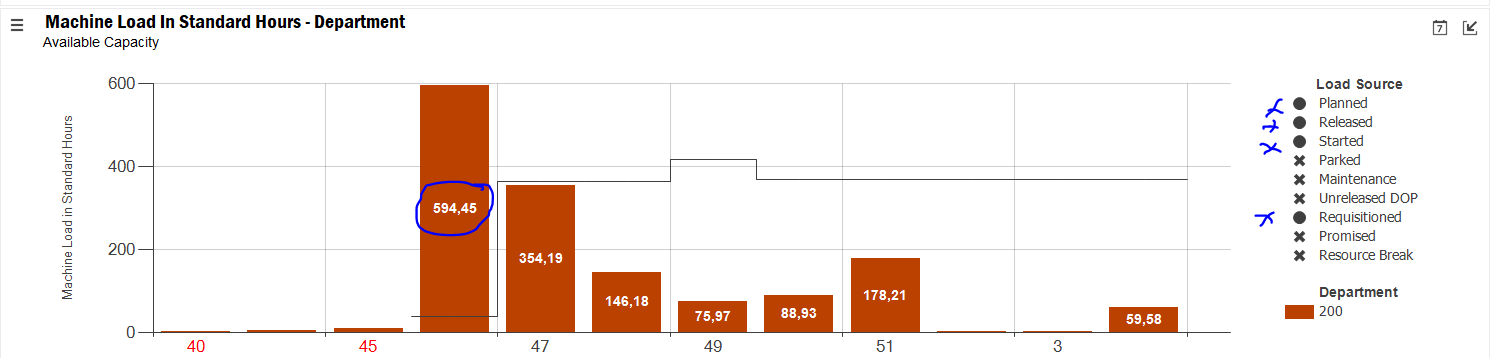
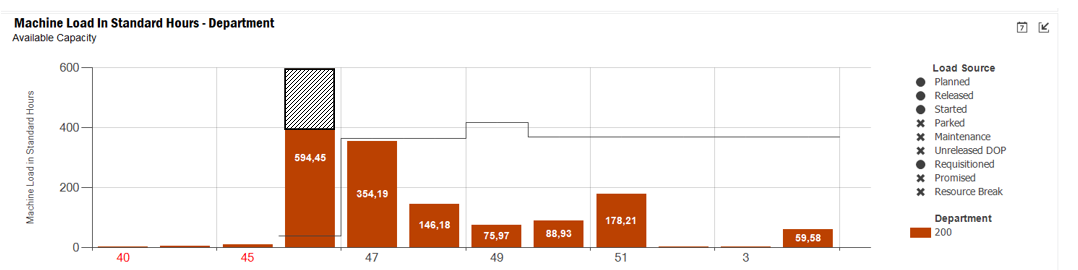
In my printout I have a global workload of 594h for W46 (including planned, requested etc etc production orders).
When I remove the requested production orders, the graph falls back to 294h (this is normal).
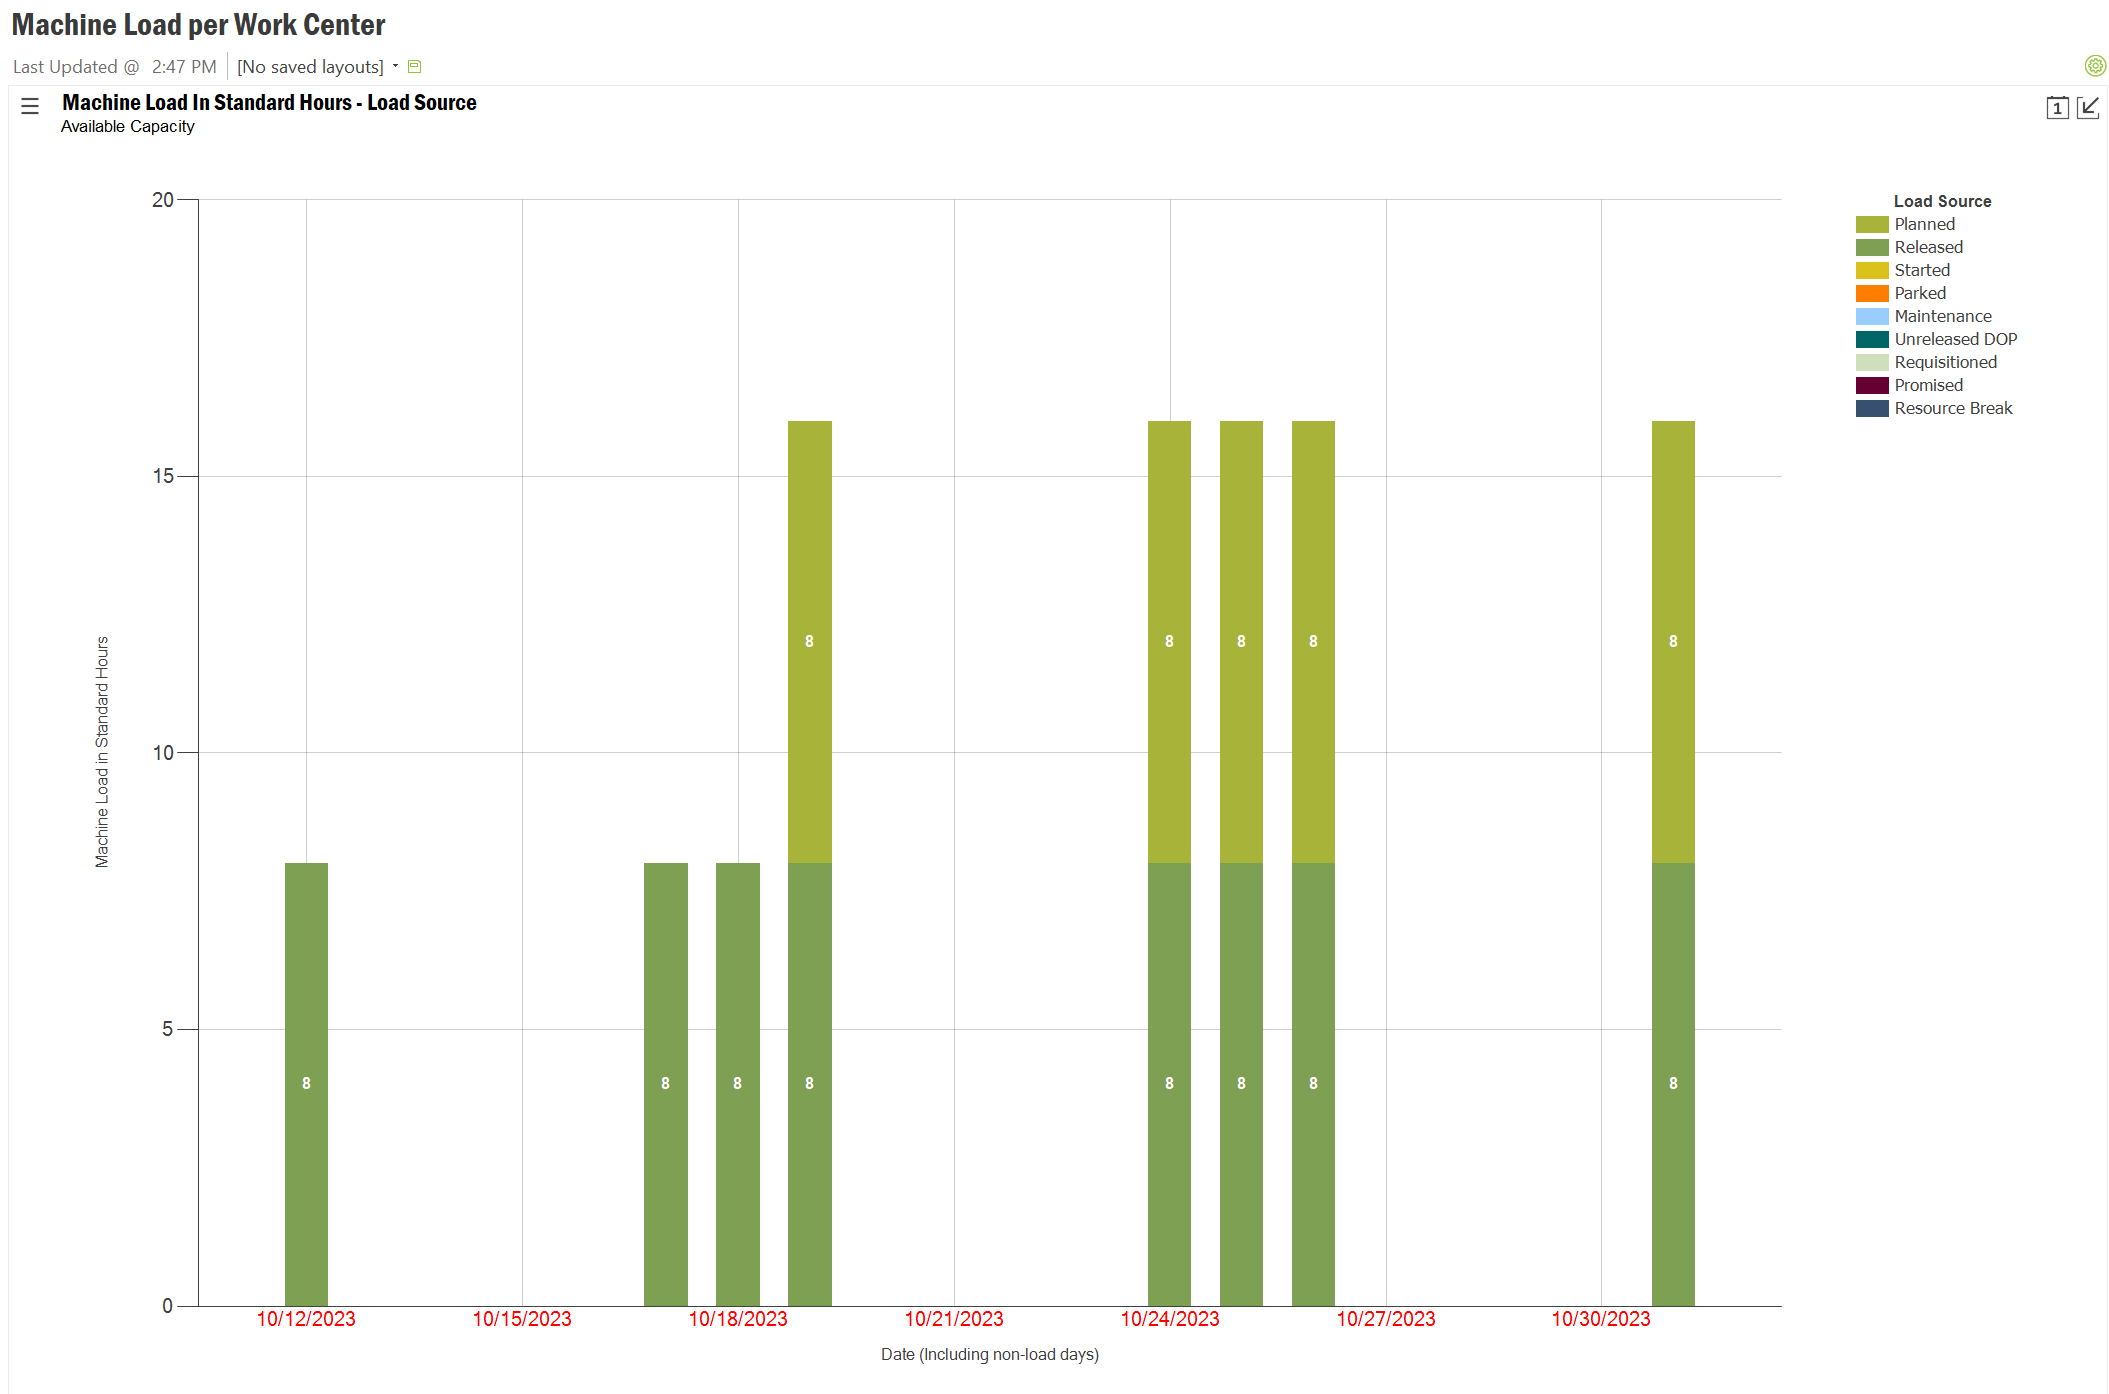
My problem is: I'd like to distinguish each load source in the graph (e.g. solid line for firm orders and dotted line for requested orders).
How can I do this?
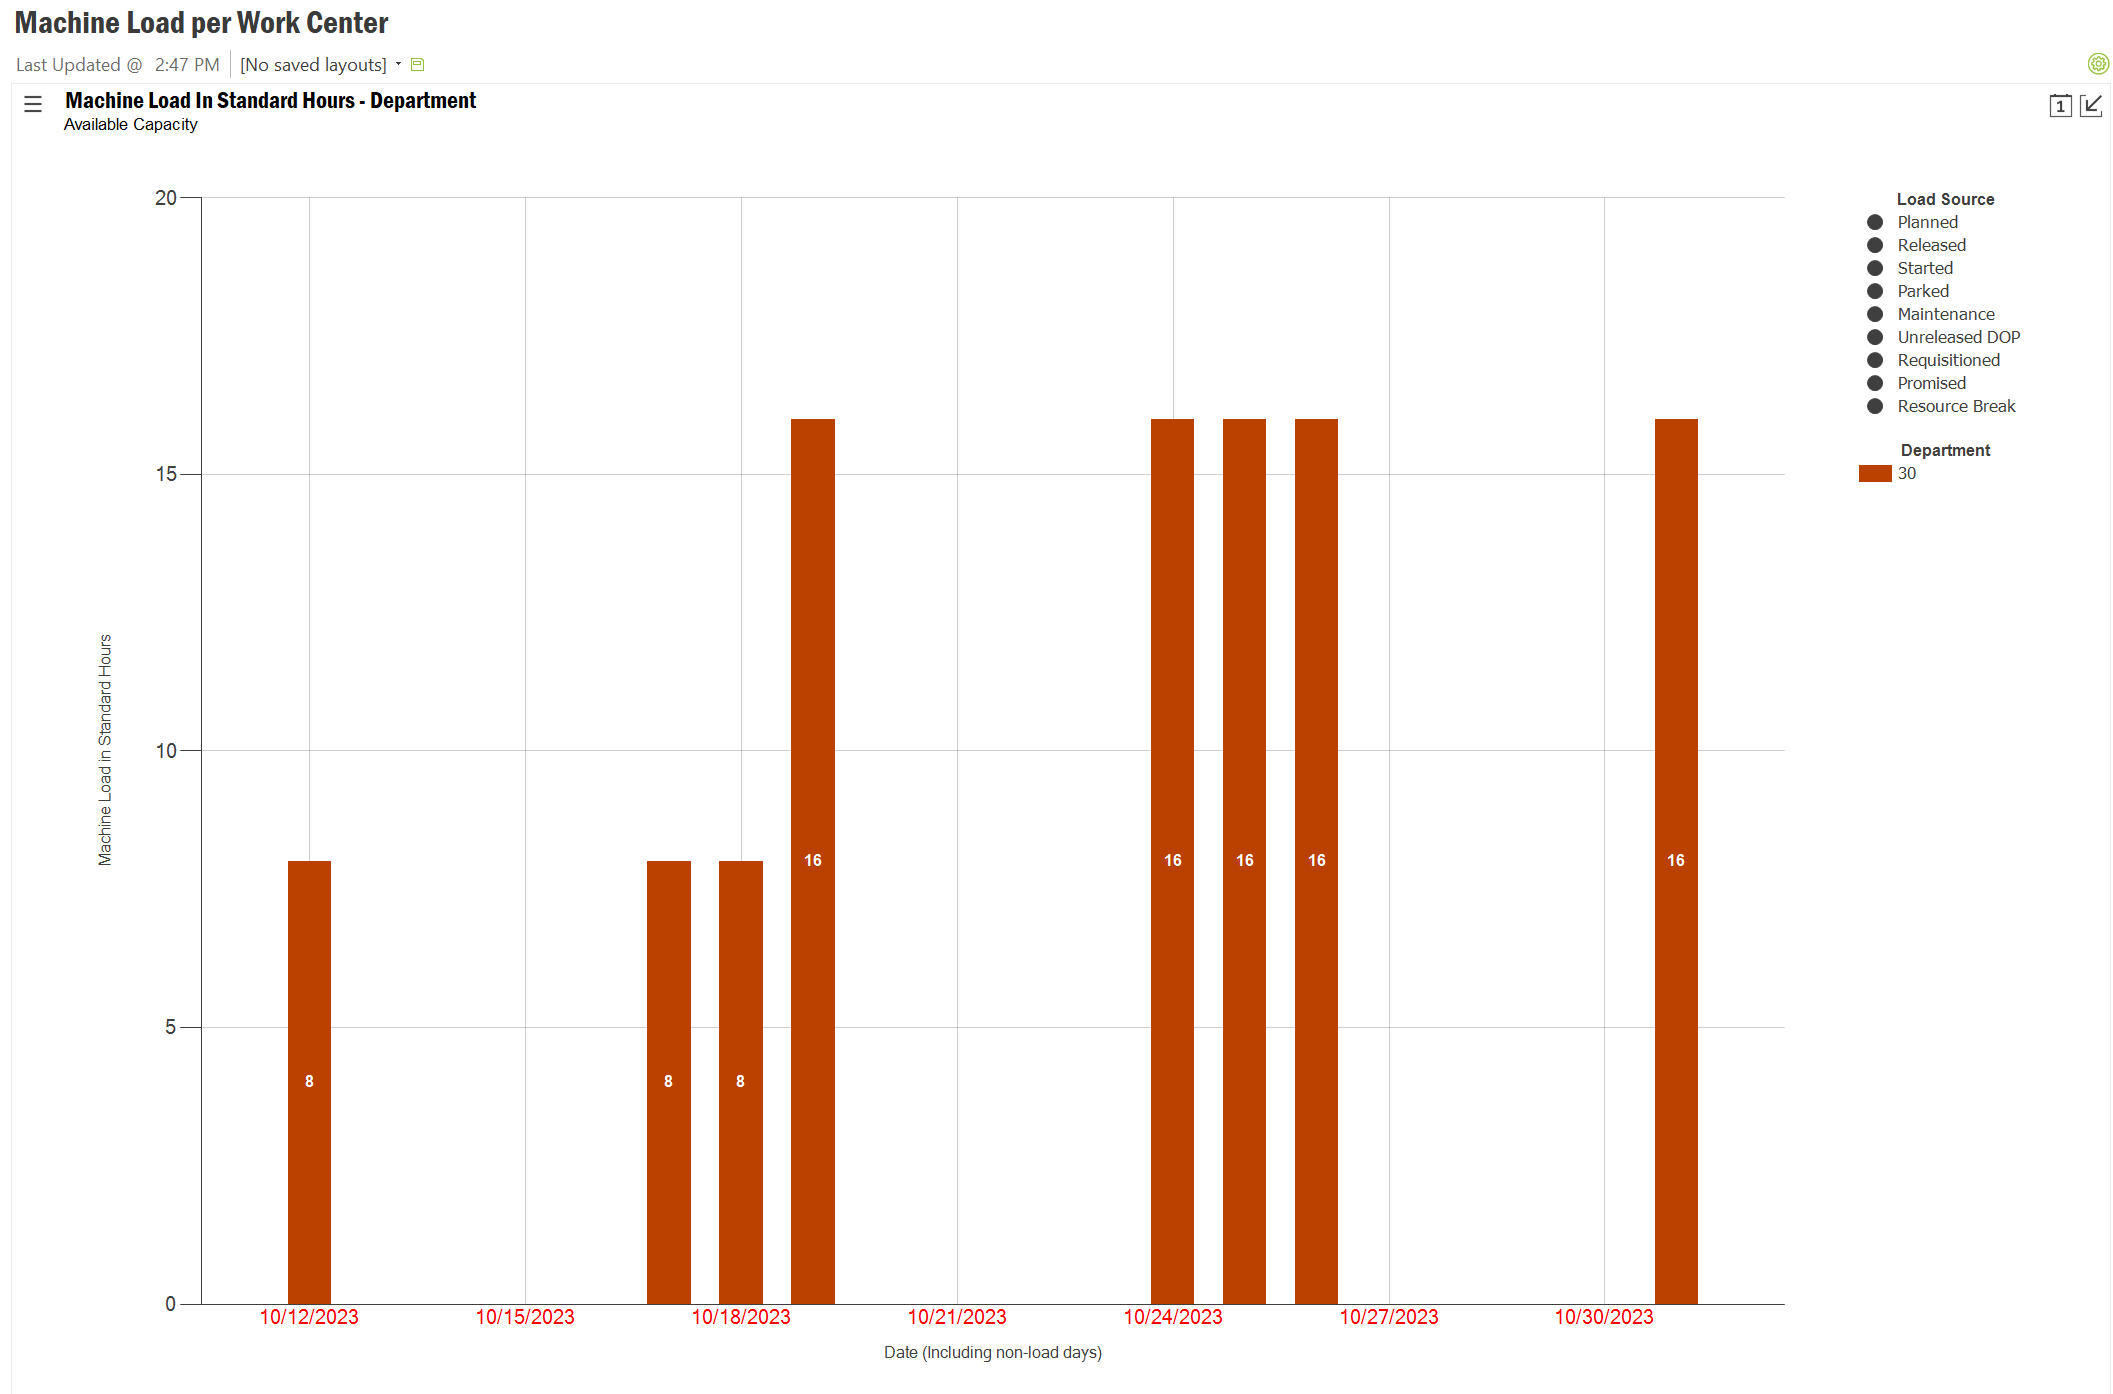
I have this