How to get profiler report via debug console

  • 29 November 2019
  • 7 replies
  • 661 views

Userlevel 6
Badge +12

Hi All,


This is on how to get a profiler report via the IEE debug console. You need plsql developer to view this report.

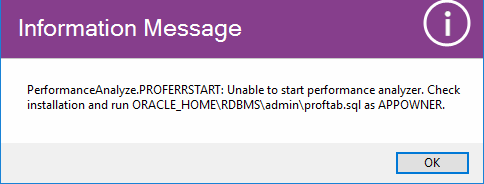
First go to the system parameters and Check the Profiling is allowed. If not set to 'ON'. Restart the IEE.


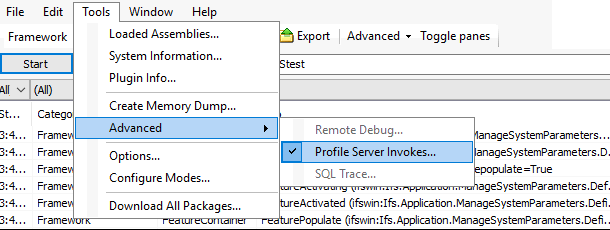
Enable the debug console. Go to tools --> Advance --> Profile Server Invoke.

In the comment section give any value. (This is useful when finding the report)


Start the session and do the steps in IEE (which you want to measure the performance bottleneck). After steps done press stop in debug console.

Now log into the plsql developer. Open a new test window. Go to the profiler tab you will see the profiler report on the name given in comment field.

Cheers!!!!


7 replies

Userlevel 6
Badge +14

Thanks @sahan for sharing this

Userlevel 7
Badge +14

Hi Sahan,

Here is a template created when you need the customer to provide you the TK PROF . This can be used as an alternate for Profiler .

A Template to take a TK PROF from a customer | IFS Community


Userlevel 7
Badge +14


Here is a way to enable Trace file generation from a PLSQL 


Enable trace - Alter session set sql_trace=true;

Enable timed statistics - Alter session set timed_statistics=true

Set an identifier to the trace file - ALTER SESSION SET tracefile_identifier=<<identifier>>

Disable trace - ALTER SESSION SET SQL_TRACE=FALSE;

Userlevel 4
Badge +8

Hi Sahan,

Thank you very much for the valuable information. When I tried to do it, got below error. Is there a way to create those tables from IEE too? I have seen that the tables can be created using a test window in PlSql developer. But it this scenario, I am using sql developer.


Best Regards,
Nisansala

Userlevel 6
Badge +12

Hi NIsansala,

I haven’t encountered this before. Quick advance search showing there is an patch released for (app9 126474) case id G1623354.

In one case  I found below findings:

“When you try to use Performance Analyzer on an environment where the Oracle Profiler Objects have not been deployed you receive the following error:

    PerformanceAnalyze.PROFERRSTART: Unable to start performance analyzer. Check installation and run ORACLE_HOME\RDBMS\admin\proftab.sql as APPOWNER.

When checking the F1 documentation under https://wis.ifsworld.com/f1docs/apps10upd2/foundation1/050_development/050_development_tools/078_perf_analyzer/#Configuring_the_Analyzer it says the following though:

    Run the script  "<ORACLE_HOME >\Rdbms\Admin\Proftab.sql" as user SYS.

As you can see one says to deploy the script as IFSAPP and the other one as SYS. I think SYS is correct and as such the error message should be corrected to reflect this accordingly..”


Most probable this error occurs due to analyzer not been installed.

Hope this helps.

Badge +1

Open the Performance Profiler by choosing Debug > Performance Profiler (or Alt + F2). The tool shows each event in a list view.

Userlevel 6
Badge +12

Adding this for future references:

received the same error Nisansala mentioned I was able to resolve this by:

  1. log into the plsql developer and open a test window and click on profiler button
  2. This will ask to create relevant tables for the profiler. Press Ok
  3. Retry the IEE steps in debug console (restart the IEE if needed)

Reply