Hi,
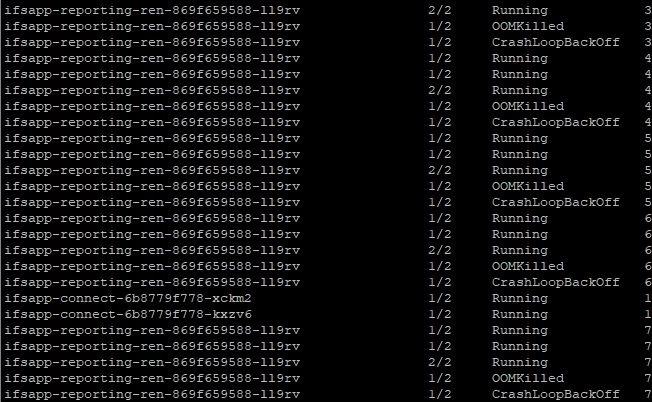
We had issue with constantly restarting POD ifsapp-connect, which caused a lot of issues in system. For example if our ifsapp-connect had restart our EDI orders was not proceed. We increased number of replicas to 2 and for now it seems all okay, but when I monitor our environment I can see that there are restart also but without any issues for example with EDI. For now I have questions:
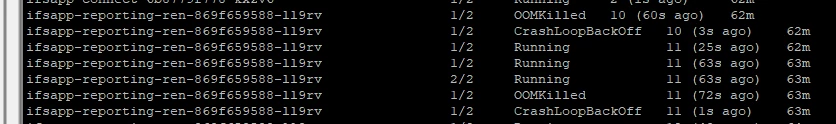
- Why is it caused that those pods are still restarting?
- If POD has been restarted we should delete it and let it get up again?
- How we can see what happening and what is the cause of restart on this certain pod?