In some examples and part of the IFS documentation I came across the following:

com.ifsworld.fnd.bpa.process.LoggerDelegate as JavaScript

It supposes to help me debugging a flow.

However I can't find how to use it (I don't mean to prepare the task in the flow, that I'm capable of).

I want to know if I need to turn on Watch? Do I see anything happening in the IFS Cloud > Debug > Enable Debug Console or the Log Window? Do I have to go down a level deeper in the network activities of my browser to see additional logging? Do I have to prepare an unique etag variable that can be used/seen?

Any support is helpful. Thanks

Hi,
it is probably about this:


Workflow Tooling - Technical Documentation For IFS Cloud

BR
Filip


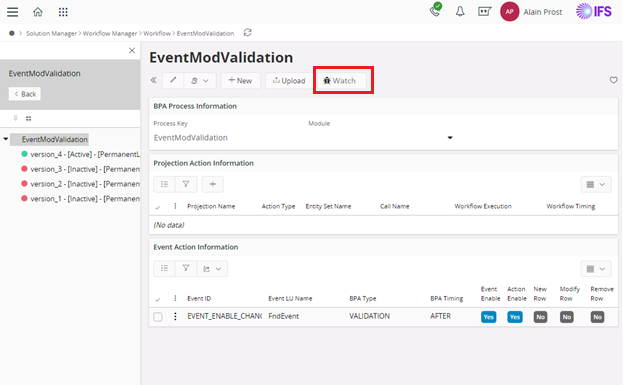
Yes, @InfFilipV It has to do with just that icon. Still, I'm confused. I start the watch and then what? Do I see something in addition to the regular output when validating the flow? Help doesn't bring me to other ideas. Help states 'Starting logging deletes all previous logs for this User / Process combination.’’ So there is something logged, but where and what?

BPA remains a somewhat mystery for me. I see its potential, but getting it to work is so time consuming (read as: steep learning curve).


Hi,
after “Start Watch”, you should execute process witch trigger this workflow.
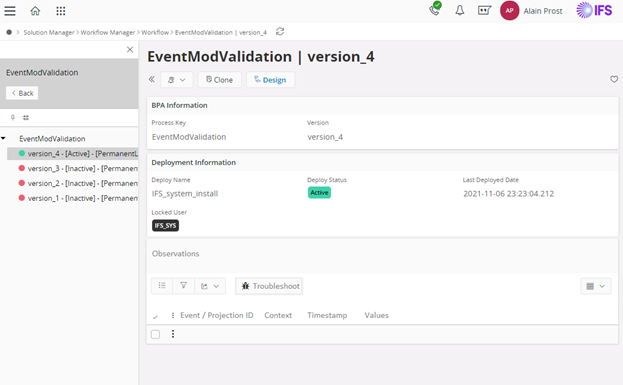
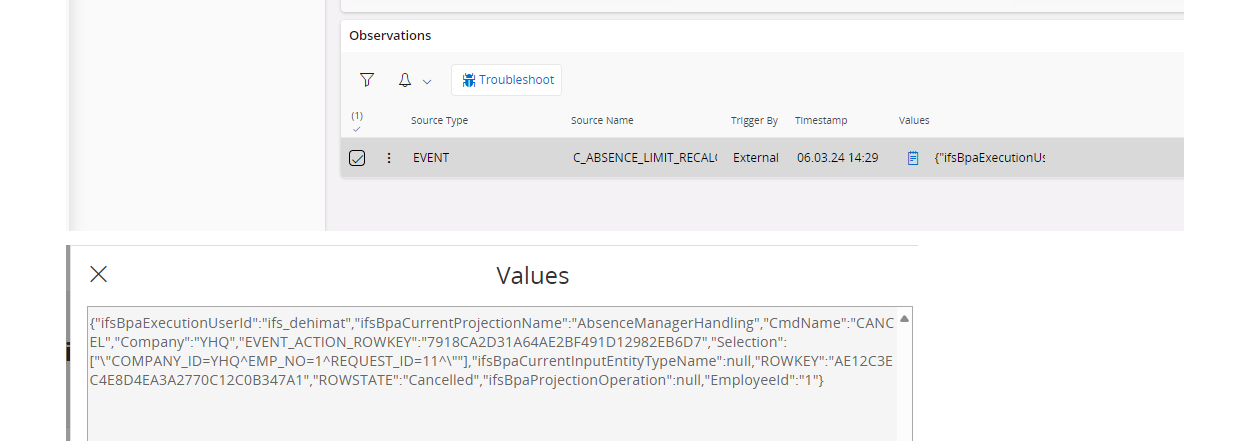
Then are input parameters logged in table “Observations”, you can see in second screen.

The records persist here till next “Start Watch” click.


it is for “Live” debugging and you catch parameter so you can “Troubleshoot” workflow - execute with same parameters.


BR
Filip​​​​​​​


Reply