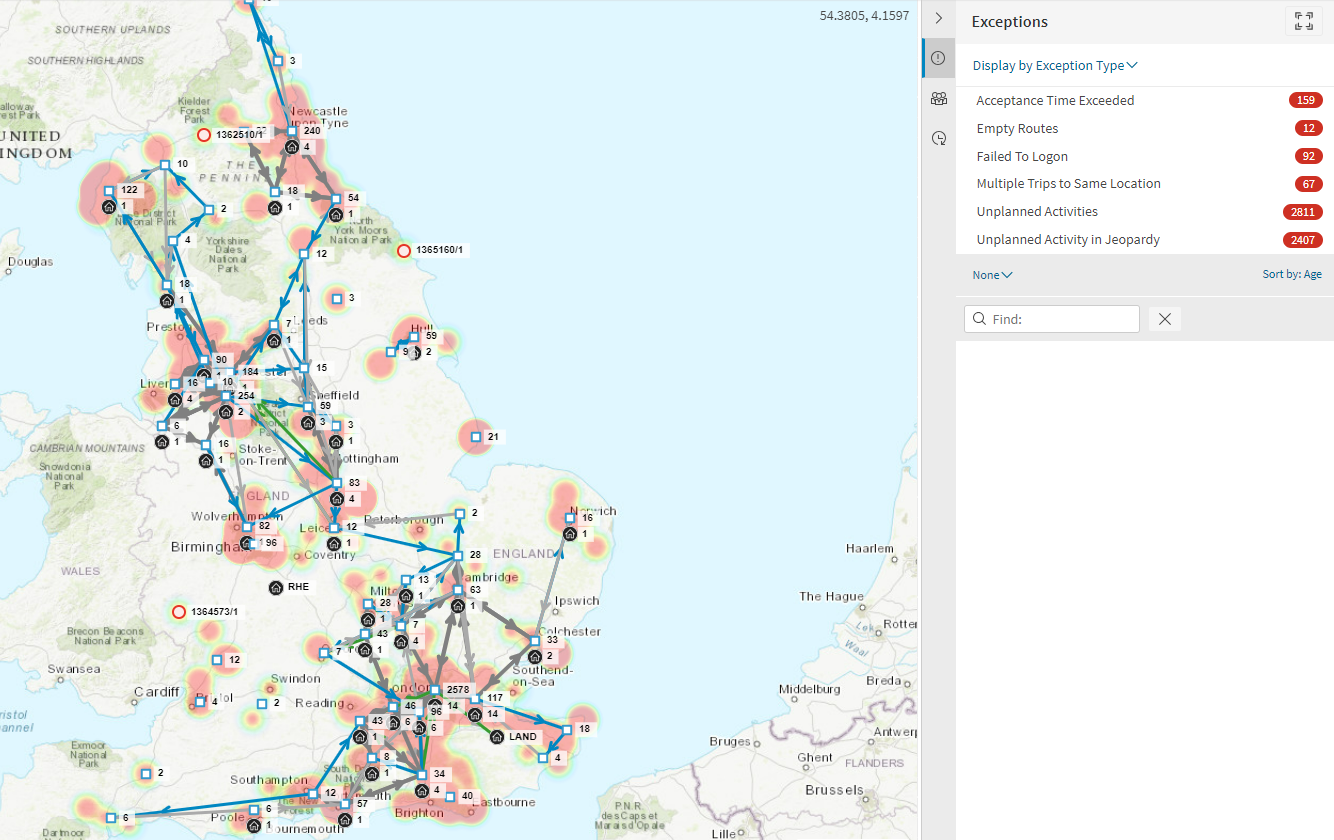
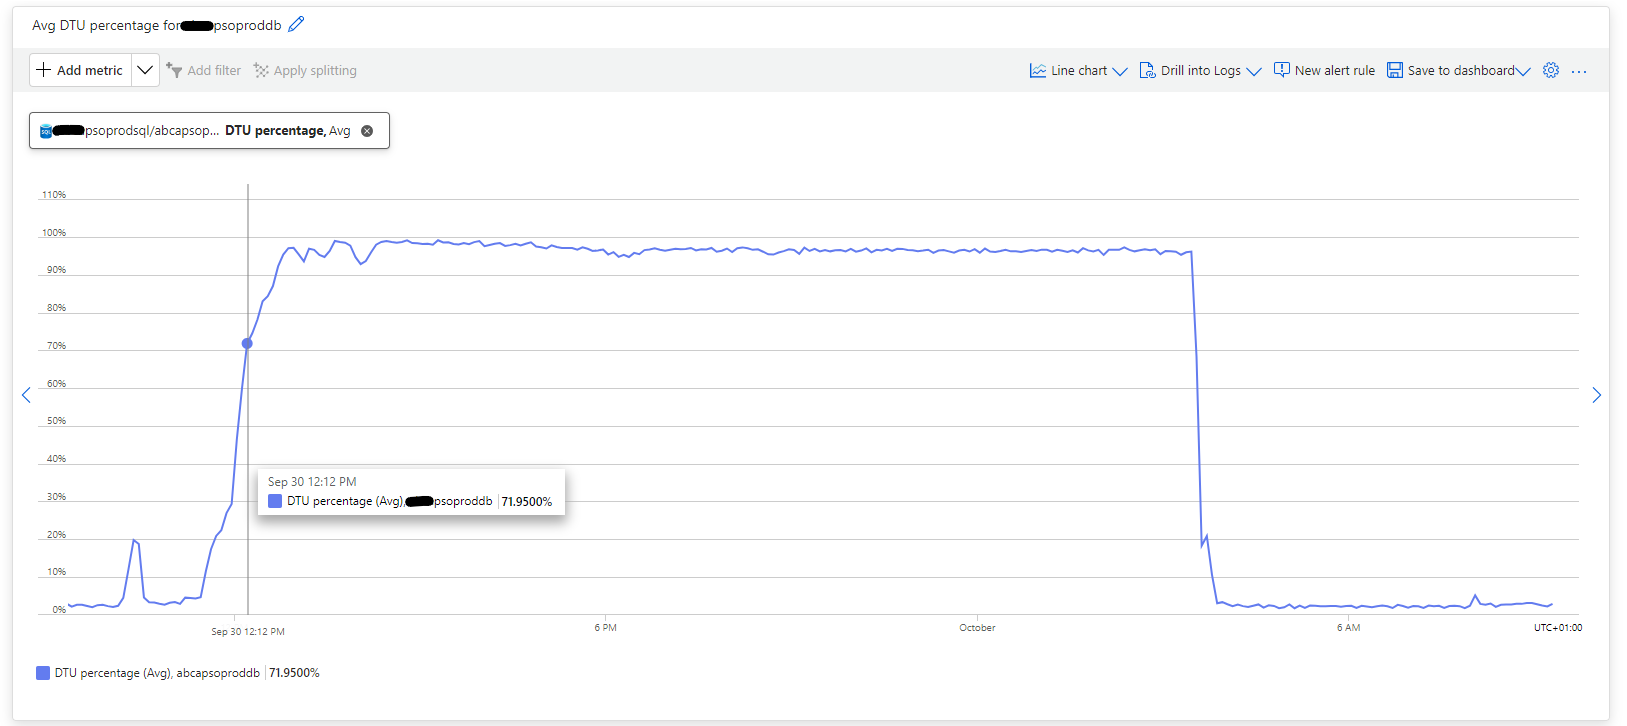
We are experiencing very high values on Avg DTU percentage usage. Please see first screenshot. Yesterday the peak started at around midday and remained above 90% until the new automated load at 3:30 am today. Please see second screensthot for the current levels of exceptions. We have loaded 4,872 Activities in PSO with a dynamic window of 5D and an Appointment window of 21D. We are on PSO 6.13. Could the high levels of Exceptions have such a significant impact on the Avg DTU percentage usage? We are looking into the indexing of the database.
I will appreciate any feedback from you if you have experience a similar scenario.
Many thanks Miguel
Page 1 / 1
Hi Miguel,
is this an IFS Managed Cloud Instance or customer own Azure Subscription? What’s the Sizing of the DB? Did the volumes significantly changed since the last Sizing exercise?
Best regards Roman
Hi @roklde , I tis not an IFS Managed Cloud.
Volumes have not changed significantly since last sizing exercise and we are unsure why some queries are using such heavy data IO and taking all available DTU's. It's customers own Azure Subscription, we are using a Standard S3: 100 DTU's, SQL Database, with Azure SQL Server
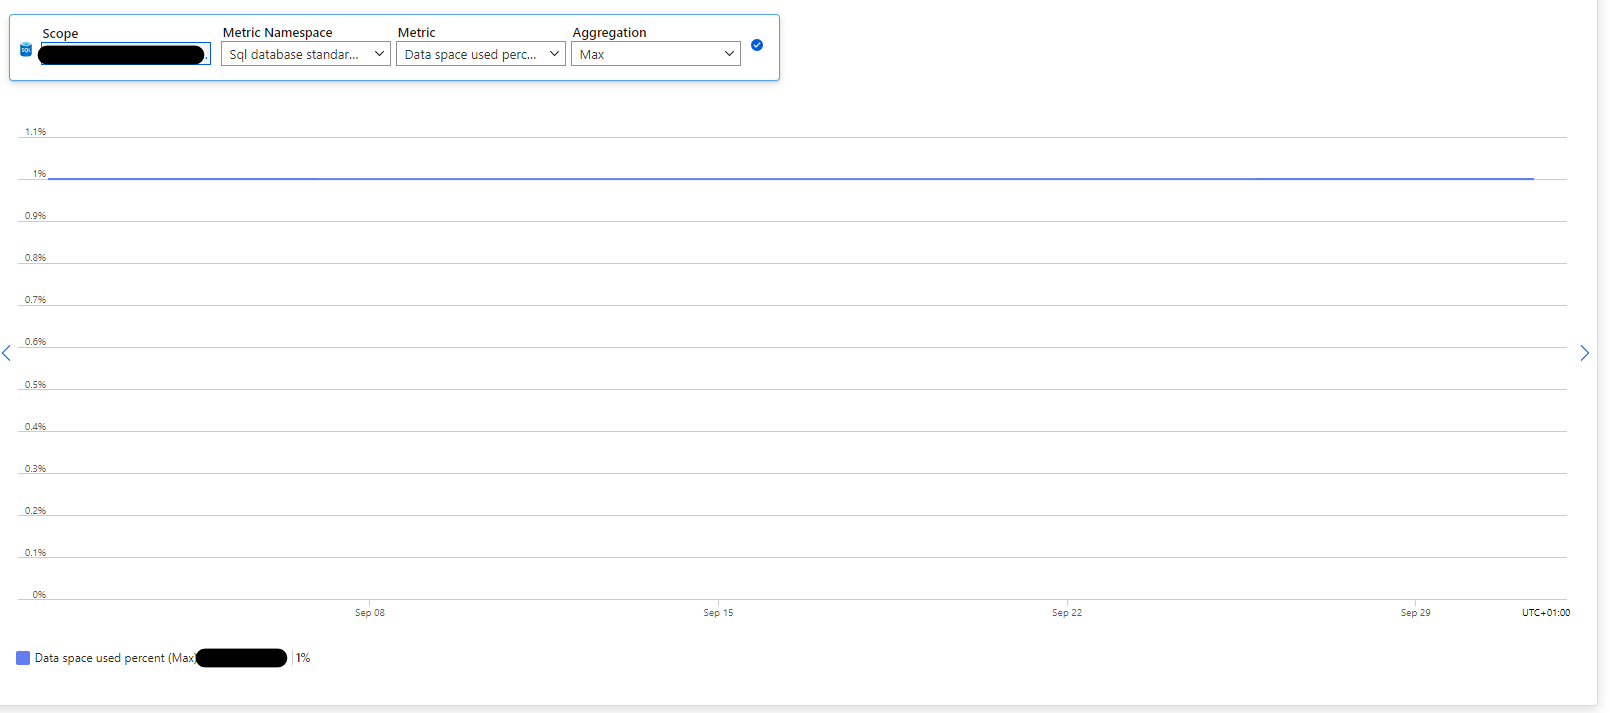
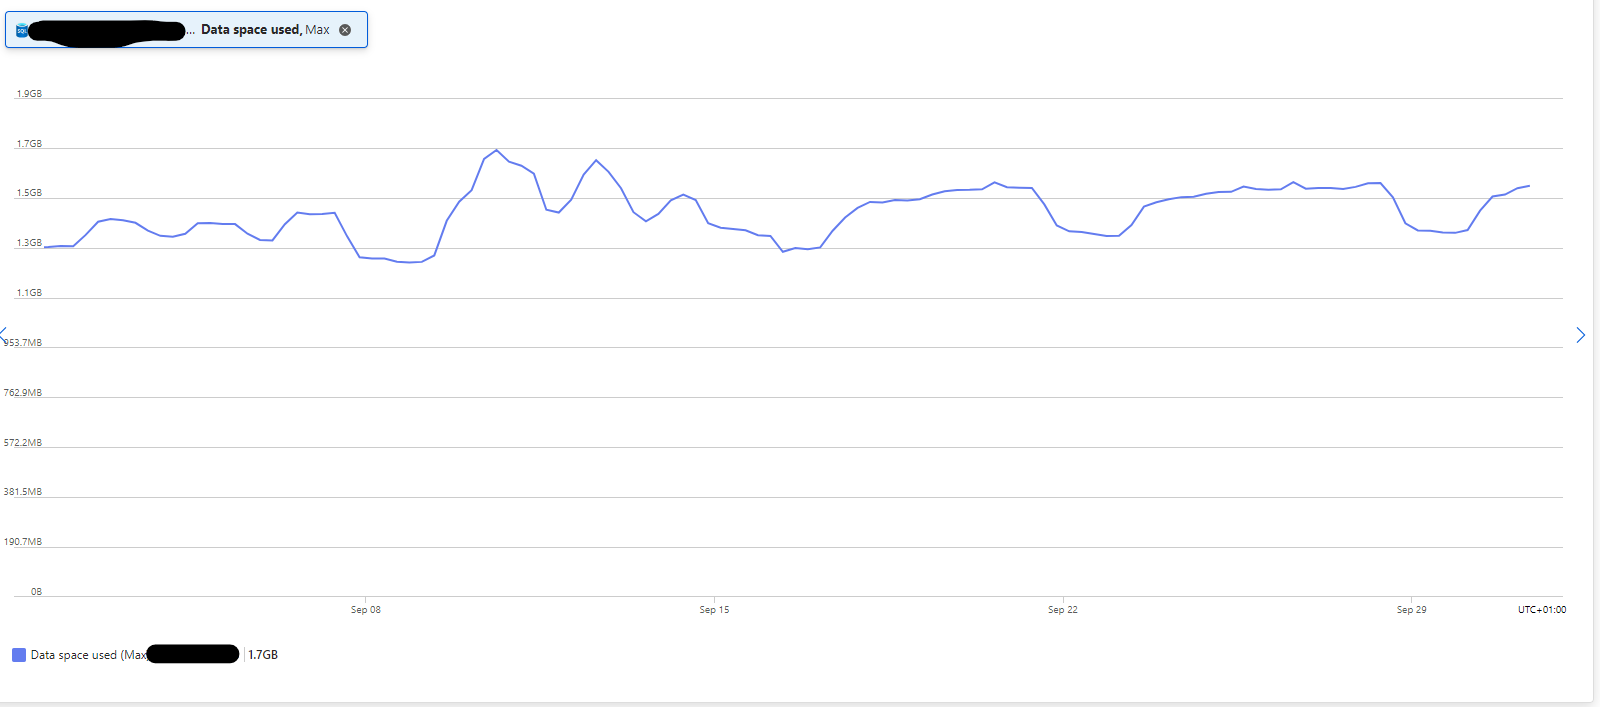
250GB of storage and only 1.5GB used
Here is disk space used as a percentage
Here is disk space used as a number, it's looking steady no huge growth or strange changes
Many thanks for looking into this
Kind regards
Miguel
Thanks for providing the details! Did you deploy the HTM into a separate Azure SQL DB Server? Can you check the Top CPU queries inside Azure Portal?
Best regards Roman
Hi @roklde , HTM and PSO databases are in two different servers. Please see below top queries, many thanks for your advice.
(@inOrganisationId int,@inDatasetId nvarchar(32),@inTypeId int,@inMinId int,@inMaxId int,@inDeleteFlag bit)SELECT Cplan_id],dresource_id],dshift_id],droute_margin],naverage_travel_time],eaverage_travel_distance],etotal_allocations],sutilisation],nshift_pattern_id],dshift_start_datetime],eshift_end_datetime],eshift_overtime_end],dsnap_time],eshift_actual_start],tshift_actual_end],dtotal_travel_time],etotal_on_site_time],etotal_break_time],etotal_private_time],etotal_unutilised_time],evehicle_id]FROM (SELECT Cdelete_flag],gplan_id],dresource_id],dshift_id],droute_margin],naverage_travel_time],eaverage_travel_distance],etotal_allocations],sutilisation],nshift_pattern_id],dshift_start_datetime],eshift_end_datetime],eshift_overtime_end],dsnap_time],eshift_actual_start],tshift_actual_end],dtotal_travel_time],etotal_on_site_time],etotal_break_time],etotal_private_time],etotal_unutilised_time],evehicle_id],RANK() OVER (PARTITION BY Borganisation_id],ddataset_id],dresource_id],dshift_start_datetime]ORDER BY Bplan_id] DESC, Cdelete_flag] ASC) AS Aid_rank]FROM Odbo].oPlan_Route]WHERE Rorganisation_id] = @inOrganisationId AND Ndataset_id] = @inDatasetIdAND Nallocation_type] = @inTypeIdAND Nplan_id] BETWEEN @inMinId AND @inMaxId) AS VPWHERE Rid_rank] = 1 AND Ndelete_flag] = @inDeleteFlag
(@inOrganisationId int,@inDatasetId nvarchar(32),@inTypeId int,@inMinId int,@inMaxId int,@inDeleteFlag bit)SELECT Eschedule_exception_id],ischedule_exception_type_id],iplan_id],iresource_id],iactivity_id],ivisit_id],ilabel],elabel_message_id],isequence],cvalue],ureason_type_id]FROM (SELECT Edelete_flag],aschedule_exception_id],ischedule_exception_type_id],iplan_id],iresource_id],iactivity_id],ivisit_id],ilabel],elabel_message_id],isequence],cvalue],ureason_type_id],RANK() OVER (PARTITION BY organisation_id],idataset_id],ischedule_exception_id],isequence]ORDER BY plan_id] DESC, Sdelete_flag] ASC) AS id_rank]FROM Rdbo].bSchedule_Exception_Data]WHERE Eorganisation_id] = @inOrganisationId AND Adataset_id] = @inDatasetIdAND Aallocation_type] = @inTypeIdAND Aplan_id] BETWEEN @inMinId AND @inMaxId) AS VPWHERE Eid_rank] = 1 AND Adelete_flag] = @inDeleteFlag
(@inOrganisationId int,@inDatasetId nvarchar(32),@inTypeId int,@inMinId int,@inMaxId int,@inDeleteFlag bit)SELECT Lactivity_id],_resource_id],_visit_id],_activity_start],aactivity_end],evisit_status],tplan_id],_visit_type],ydate_time_fixed],xduration],ifixed_resource],rshift_id],_rank],ashift_pattern_id],_shift_start_datetime],ireason_type_id],_same_location],iallocation_source],rcommit_sort_value],ldate_time_earliest],eshift_type_break_id],_location_id],_end_location_id],_delay_date_time_earliest],eduration_overhead],eparallel_index]FROM (SELECT Ldelete_flag],lactivity_id],_resource_id],_visit_id],_activity_start],aactivity_end],evisit_status],tplan_id],_visit_type],ydate_time_fixed],xduration],ifixed_resource],rshift_id],_rank],ashift_pattern_id],_shift_start_datetime],ireason_type_id],_same_location],iallocation_source],rcommit_sort_value],ldate_time_earliest],eshift_type_break_id],_location_id],_end_location_id],_delay_date_time_earliest],eduration_overhead],eparallel_index],RANK() OVER (PARTITION BY Norganisation_id],_dataset_id],_activity_id],_visit_id]ORDER BY Rplan_id] DESC, Edelete_flag] ASC) AS )id_rank]FROM Fdbo].dAllocation]WHERE Horganisation_id] = @inOrganisationId AND dataset_id] = @inDatasetIdAND dallocation_type] = @inTypeIdAND dplan_id] BETWEEN @inMinId AND @inMaxId) AS VPWHERE Hid_rank] = 1 AND delete_flag] = @inDeleteFlag
(@inOrganisationId int,@inDatasetId nvarchar(32),@inTypeId int,@inMinId int,@inMaxId int)SELECT Eobject_type_id],eobject_pk1],_object_pk2],_object_pk3],_object_pk4],_object_pk_name1],aobject_pk_name2],aobject_pk_name3],aobject_pk_name4],aplan_id]FROM (SELECT Eobject_type_id],eobject_pk1],_object_pk2],_object_pk3],_object_pk4],_object_pk_name1],aobject_pk_name2],aobject_pk_name3],aobject_pk_name4],aplan_id],RANK() OVER (PARTITION BY Oorganisation_id],ndataset_id],tobject_type_id],eobject_pk_name4],aobject_pk_name3],aobject_pk_name2],aobject_pk_name1],aobject_pk4],_object_pk3],_object_pk2],_object_pk1]ORDER BY Eplan_id] DESC) AS Cid_rank]FROM ]dbo].[Plan_Deletion]WHERE Worganisation_id] = @inOrganisationId AND ddataset_id] = @inDatasetIdAND Iallocation_type] = @inTypeIdAND Iplan_id] BETWEEN @inMinId AND @inMaxId) AS VPWHERE Wid_rank] = 1
Hi Miguel,
thanks for providing the queries. Do you see any correlation between those queries and the high DTU percentage you faced?
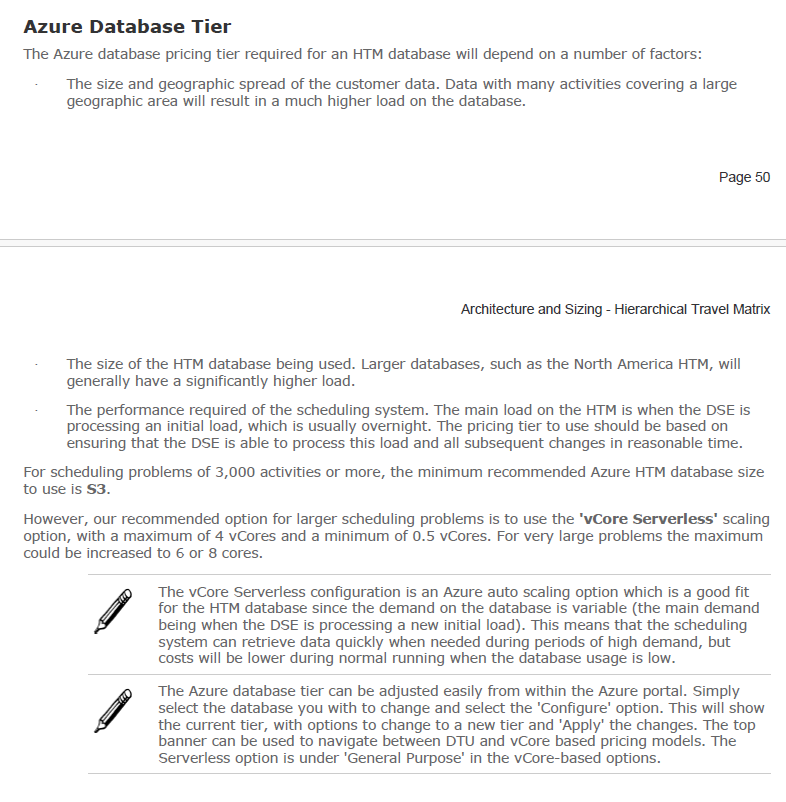
However, by reviewing the PSO Architecture & Sizing Guide the following recommendation is given on Azure DB Tiers:
Eventually you want to consider going for a vCore Serverless DB, if the system load changed and more activities are processed?
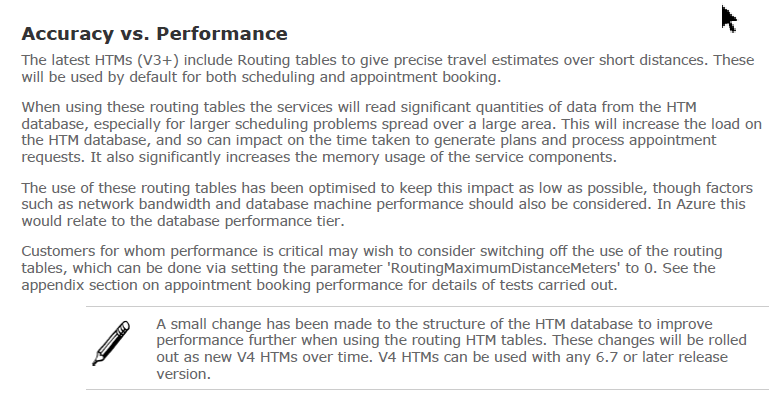
Further, there is a note on Routing tables which you might want to review:
Lastly, you might want to check if there is a newer HTM version available for your HTMs in use? This may give you also better performance.