Question

Resource Analysis - Individual Loading

  • 15 April 2021
  • 2 replies
  • 245 views

Userlevel 2
Badge +5

I’m trying to build some Power BI reports based on outputs from IFS but am struggling with a few tables.

I particularly interested in resource management, forecast loading and capacity vs planned hours.

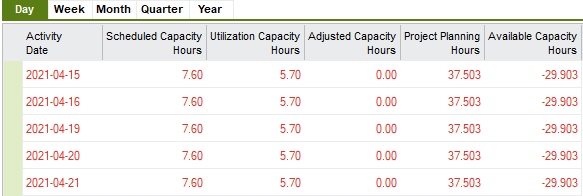
From Resource Management > Analysis > Resource Analysis

I can see good detail by day, week, month etc, with each option showing me the scheduled capacity hours, utilization capacity hours and available capacity hours


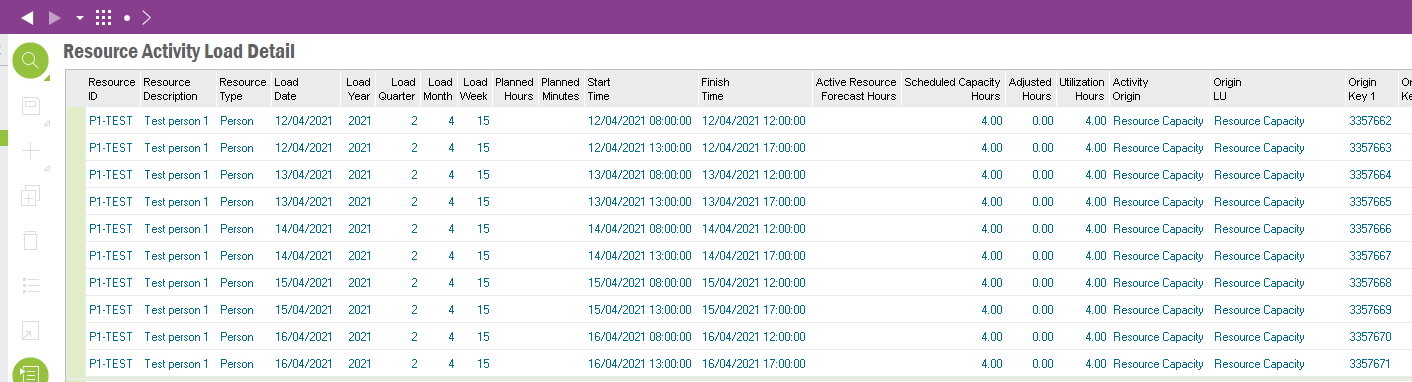
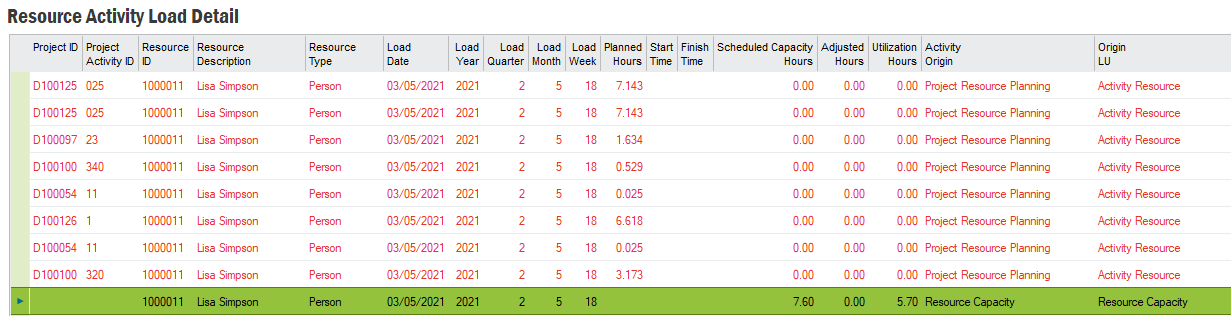
however when i then look at the Resource Activity Load Detail for that individual the Schedule Capacity Hours and Utilization Hours show as 0


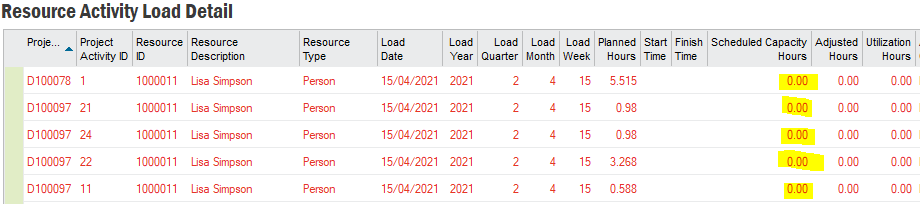
The ‘Use HR Schedule’ is selected and schedule capacity is set as ‘Finite Capacity’ in the Resource Navigator.

I don’t understand why the scheduled capacity hours are not showing on the activity load detail view.


This topic has been closed for comments

2 replies

Userlevel 2
Badge +3

When drilling down into Resource Activity Load Detail it is normally from a specific section in the chart - therefore the details seen initially relate to that specific demand, whether it is Project Planning, Work Task, Absence etc.

Therefore as the demands are treated as separate records then so is the capacity.

So in order to see the capacity values in Resource Activity Load Detail then either drill down from the graph by clicking the capacity line point or, within Resource Activity Load Detail, query for records where either the  Activity Origin or the Origin LU is 'Resource Capacity'.


Userlevel 2
Badge +5

Thank you @Hugh Batho 

Using the search query I’m able to see the Resource Capacity, as well as the Project Resource Planning hours for the particular resource id.


To generate my Power BI report it looks like I’ll have to run two separate queries (one for Resource Capacity and one for Project Resource Planning) and link the two tables (by the Resource ID field). At least now I can see that the data exists.

Thanks again